

Clinical magnetoencephalography for neurosurgery
- PMID: 21435568
- PMCID: PMC3085532
- DOI: 10.1016/j.nec.2010.11.006
Clinical magnetoencephalography for neurosurgery
Abstract
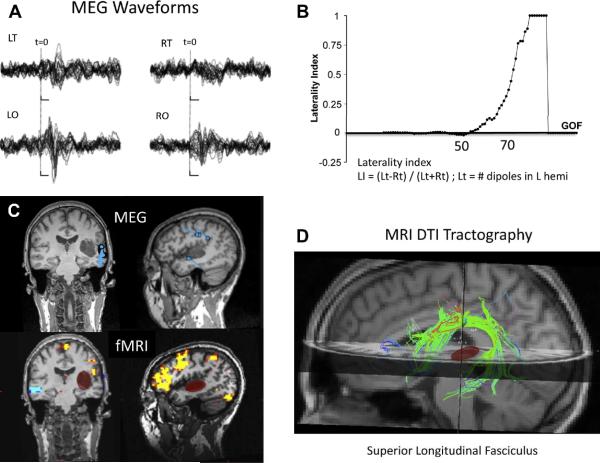
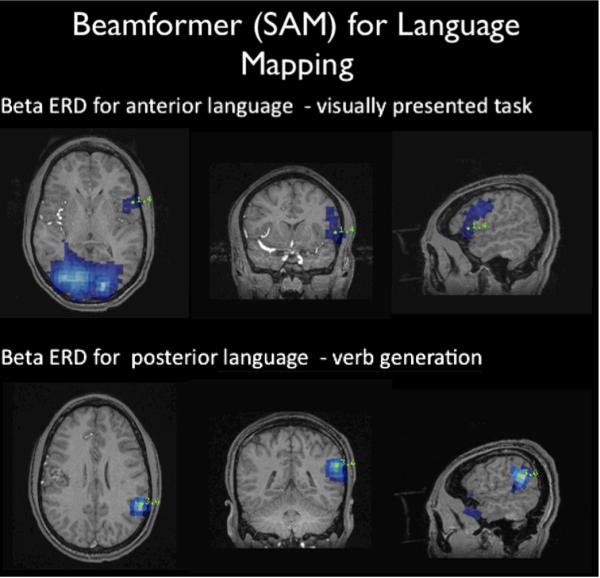
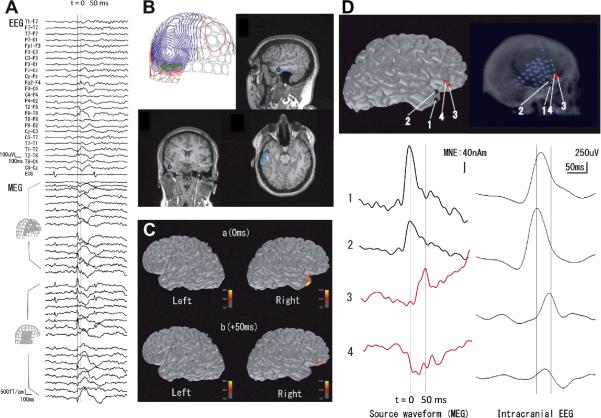
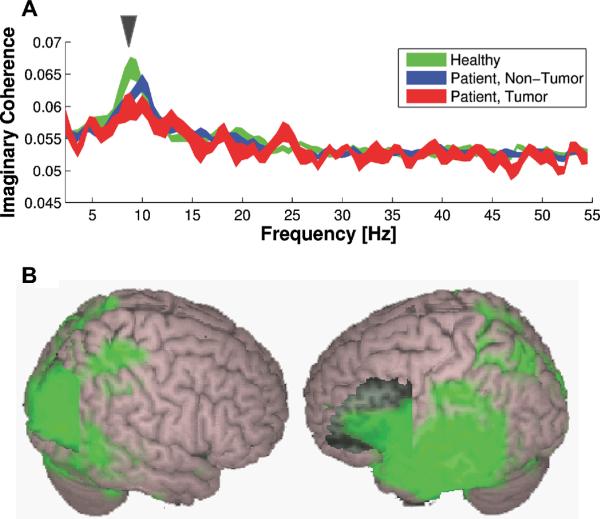
Noninvasive neuroimaging aids in surgical planning and in counseling patients about possible risks of surgery. Magnetoencephalography (MEG) performs the most common types of surgical planning that the neurosurgeon faces, including localization of epileptic discharges, determination of the hemispheric dominance of verbal processing, and the ability to locate eloquent cortex. MEG is most useful when it is combined with structural imaging, most commonly with structural magnetic resonance (MR) imaging and MR diffusion imaging. This article reviews the history of clinical MEG, introduces the basic concepts about the biophysics of MEG, and outlines the basic neurosurgical applications of MEG.
Copyright © 2011 Elsevier Inc. All rights reserved.
Figures
Similar articles
-
The role of magnetoencephalography in epilepsy surgery.Neurosurg Focus. 2008 Sep;25(3):E16. doi: 10.3171/FOC/2008/25/9/E16. Neurosurg Focus. 2008. PMID: 18759617 Review.
-
The role of magnetoencephalography in pediatric epilepsy surgery.Childs Nerv Syst. 2006 Aug;22(8):779-85. doi: 10.1007/s00381-006-0124-5. Epub 2006 Jun 28. Childs Nerv Syst. 2006. PMID: 16804713 Review.
-
Magnetocephalography: a noninvasive alternative to the Wada procedure.J Neurosurg. 2004 May;100(5):867-76. doi: 10.3171/jns.2004.100.5.0867. J Neurosurg. 2004. PMID: 15137606
-
Localization of language cortices by functional MR imaging compared with intracarotid amobarbital hemispheric sedation.AJR Am J Roentgenol. 1997 Aug;169(2):575-9. doi: 10.2214/ajr.169.2.9242780. AJR Am J Roentgenol. 1997. PMID: 9242780
-
Magnetoencephalography in neurosurgery.Neurosurgery. 2006 Sep;59(3):493-510; discussion 510-1. doi: 10.1227/01.NEU.0000232762.63508.11. Neurosurgery. 2006. PMID: 16955031 Review.
Cited by
-
Faster and improved 3-D head digitization in MEG using Kinect.Front Neurosci. 2014 Oct 28;8:326. doi: 10.3389/fnins.2014.00326. eCollection 2014. Front Neurosci. 2014. PMID: 25389382 Free PMC article.
-
Magnetoencephalography for the pediatric population, indications, acquisition and interpretation for the clinician.Neuroradiol J. 2025 Feb;38(1):7-20. doi: 10.1177/19714009241260801. Epub 2024 Jun 12. Neuroradiol J. 2025. PMID: 38864180 Free PMC article. Review.
-
Magnetoencephalography.Pract Neurol. 2014 Oct;14(5):336-43. doi: 10.1136/practneurol-2013-000768. Epub 2014 Mar 19. Pract Neurol. 2014. PMID: 24647614 Free PMC article. Review. No abstract available.
-
Presurgical Assessment of the Sensorimotor Cortex Using Resting-State fMRI.AJNR Am J Neuroradiol. 2016 Jan;37(1):101-7. doi: 10.3174/ajnr.A4472. Epub 2015 Sep 17. AJNR Am J Neuroradiol. 2016. PMID: 26381564 Free PMC article.
-
Brain-computer interfaces: the innovative key to unlocking neurological conditions.Int J Surg. 2024 Sep 1;110(9):5745-5762. doi: 10.1097/JS9.0000000000002022. Int J Surg. 2024. PMID: 39166947 Free PMC article. Review.
References
-
- Cohen D. Magnetoencephalography: evidence of magnetic fields produced by alpha-rhythm currents. Science. 1968;161(843):784–6. - PubMed
-
- Cohen D. Magnetoencephalography: detection of the brain's electrical activity with a superconducting magnetometer. Science. 1972;175(22):664–6. - PubMed
-
- Dale AM, Halgren E. Spatiotemporal mapping of brain activity by integration of multiple imaging modalities. Curr Opin Neurobiol. 2001;11(2):202–8. - PubMed
-
- Dale AM, Liu AK, Fischl BR, et al. Dynamic statistical parametric mapping: Combining fMRI and MEG for high-resolution imaging of cortical activity. Neuron. 2000;26:55–67. - PubMed
-
- Marquardt DW. An Algorithm for Least-Squares Estimation of Nonlinear Parameters SIAM. J. Appl. Math. 1963;11(2):431–441.
Publication types
MeSH terms
Substances
Grants and funding
LinkOut - more resources
Full Text Sources
