. 2011 May 12;117(19):5142-51.
doi: 10.1182/blood-2011-01-331306. Epub 2011 Mar 24.

HIV disease progression despite suppression of viral replication is associated with exhaustion of lymphopoiesis

Affiliations

HIV disease progression despite suppression of viral replication is associated with exhaustion of lymphopoiesis

Delphine Sauce et al. Blood. .

Abstract

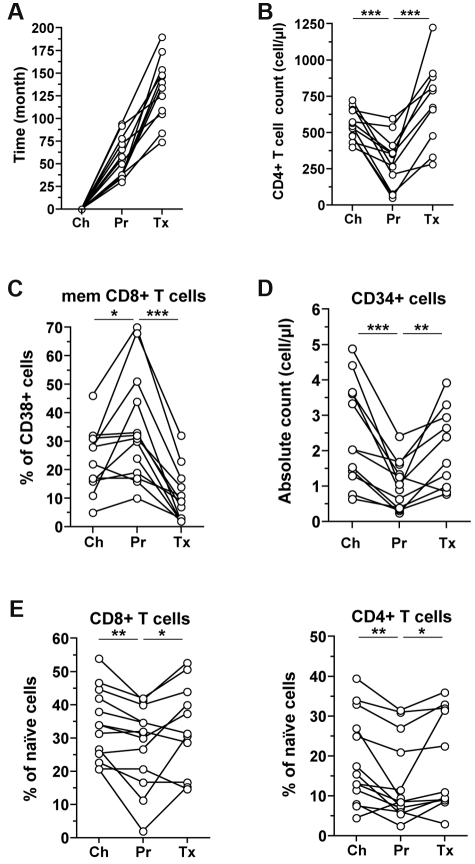
The mechanisms of CD4(+) T-cell count decline, the hallmark of HIV disease progression, and its relationship to elevated levels of immune activation are not fully understood. Massive depletion of CD4(+) T cells occurs during the course of HIV-1 infection, so that maintenance of adequate CD4(+) T-cell levels probably depends primarily on the capacity to renew depleted lymphocytes, that is, the lymphopoiesis. We performed here a comprehensive study of quantitative and qualitative attributes of CD34(+) hematopoietic progenitor cells directly from the blood of a large set of HIV-infected persons compared with uninfected donors, in particular the elderly. Our analyses underline a marked impairment of primary immune resources with the failure to maintain adequate lymphocyte counts. Systemic immune activation emerges as a major correlate of altered lymphopoiesis, which can be partially reversed with prolonged antiretroviral therapy. Importantly, HIV disease progression despite elite control of HIV replication or virologic success on antiretroviral treatment is associated with persistent damage to the lymphopoietic system or exhaustion of lymphopoiesis. These findings highlight the importance of primary hematopoietic resources in HIV pathogenesis and the response to antiretroviral treatments.


Figures

Figure 1
Figure 1
Attributes of circulating CD34+ HPCs. (A) Representative examples of CD34 and CD45 staining to identify HPCs in PBMC samples. (B) Absolute counts of CD34+ CD45low Lin cells in middle aged (M; n = 27) or old (O; n = 26) adults, and in treatment-naive HIV-1–infected patients, grouped according to CD4+ T-cell counts: > 500 CD4+ (H; n = 35), between 200 and 500 CD4+ (I; n = 44), or < 200 (L; n = 23) CD4+ T cells/μL. (C) Correlation between CD34+ HPC and CD4+ T-cell counts in treatment-naive HIV-1–infected patients. The Spearman rank test was used to determine the correlation. (D) Numbers of total or white (CFU-GM and CFU-GEMM) progenitor CFUs generated from CD34+-sorted cells of HIV-1–infected patients and healthy donors. (E) Representative stainings for CD117, CD45RA, and CD10 on CD34+-sorted cells from PBMCs of HIV-1–infected patients and healthy controls. Numbers indicate percentages of cells in the different quadrants. (F) Ratio lymphoid (CD38+ CD117 CD45RA+ CD10+) versus myeloid (CD38+ CD117+ CD45RA CD10) HPCs within CD34+ cells from PBMCs of HIV-1–infected patients and healthy controls. (G) Frequency of lymphoid HPCs in the blood of HIV-1–infected patients and healthy controls. The Mann-Whitney or Kruskal-Wallis tests were used for comparing 2 groups or ≥ 3 groups, respectively. *P < .05, **P < .01, and ***P < .001. Bars indicate the median.
Figure 2
Figure 2
Association between immune activation and altered hematopoiesis. (A) Lack of correlation between CD34+ HPC counts and viral load in treatment-naive HIV-1–infected patients. (B) Inverse correlation between CD34+ HPC counts and percentages of CD38-expressing memory CD8+ T cells in treatment-naive HIV-1–infected patients. The Spearman rank test was used to determine correlations. Plasma levels of (C) SDF-1α, IP-10, MIG and (D) sCD14 in middle-aged (M) adults and treatment-naive HIV-1–infected patients with CD4+ T-cell counts > 500 (H), between 200 and 500 (I), or < 200 (L) cells/μL. The Mann-Whitney or Kruskal-Wallis tests were used for comparing 2 groups or ≥ 3 groups, respectively. *P < .05, **P < .01, and ***P < .001. Bars indicate the median.
Figure 3
Figure 3
Exhausted lymphopoiesis in HIV-elite controller progressors. (A) Absolute counts of CD34+ CD45low Lin cells and frequency of lymphoid (CD45RA+ CD10+ CD117 CD38+) HPCs in HIV-elite controller nonprogressors (Cnp; CD4+ T-cell count > 500 cells/μL; n = 12) and progressors (Cp; CD4+ T-cell count < 350 cells/μL; n = 10). For comparison, counts in middle-aged (M; n = 27) and elderly (O; n = 26) adults are also shown. (B) Numbers of white (CFU-GM and CFU-GEMM) progenitor CFUs generated from CD34+-sorted cells of HIV-elite controller nonprogressors or progressors, and (C) absolute naive CD4+ or CD8+ T-, B-, and NK-cell counts in HIV-elite controller or comparative donor groups. Bars indicate the median. The Kruskal-Wallis test was used for group comparison. *P < .05, **P < .01, and ***P < .001.
Figure 4
Figure 4
Longitudinal follow-up during chronic infection and ART. Time interval (A), CD4+ T-cell counts (B), percentages of CD38-expressing memory CD8+ T cells (C), blood CD34+ HPC counts (D), and percentages of naive (CD45RA+ CCR7+ CD27+) CD8+ or CD4+ T cells (E) are shown for 11 HIV-1–infected patients followed longitudinally: between chronic infection (Ch), progression before treatment (Pr), and prolonged ART (Tx). The Wilcoxon test was used for comparing time points. *P < .05, **P < .01, and ***P < .001.
Figure 5
Figure 5
Recovery of lymphopoiesis with ART. (A) Absolute counts of CD34+ CD45low Lin cells in HIV-1–infected patients with low CD4+ T-cell nadir before treatment (< 200 cells/μL) and treated for > 3 years with ART, grouped according to CD4+ T-cell counts: > 500 (Hx; n = 13), between 200 and 500 (Ix; n = 28), or < 200 (Lx; n = 13) cells/μL. For comparison, counts in middle-aged control adults (M; n = 27), treatment-naive HIV-1–infected patients with CD4+ T-cell count < 200 cells/μL (L;, n = 23), and treated HIV-1–infected patients with high CD4+ T-cell nadir and counts (> 500 cells/μL) (Hxh; n = 21) are also shown. (B) CD4-to-CD8 ratios and (C) absolute naive CD4+ or CD8+ T-, B-, and NK-cell counts in ART-treated HIV-1–infected patients or comparative donor groups. Bars indicate the median. The Kruskal-Wallis test was used for group comparison. *P < .05, **P < .01, and ***P < .001.
Figure 6
Figure 6
CD4+ T-cell reconstitution and lymphopoiesis. (A) Numbers of total or white (CFU-GM and CFU-GEMM) progenitor CFUs generated from CD34+-sorted cells of treated HIV-1–infected patients (with CD4+ T-cell nadir before treatment < 200 cells/μL and for > 3 years on ART) grouped according to CD4+ T-cell counts: > 500 (Hx) or < 200 (Lx) cells/μL. Middle-aged control adults (M), treatment-naive HIV-1–infected patients with CD4+ T-cell count < 200 cells/μL (L), and treated HIV-1–infected patients with CD4+ T-cell nadir > 500 cells/μL (Hxh) are shown for comparison. (B) Frequency of lymphoid (CD45RA+ CD10+ CD117 CD38+) HPCs from PBMCs of treated HIV-1–infected patients or comparative donor groups. (C) Percentages of CD38-expressing memory CD8+ T cells and (D) plasma levels of sCD14, IP-10, MIG, and SDF-1α in treated HIV-1–infected patients and comparative donor groups. The Mann-Whitney or Kruskal-Wallis tests were used for comparing 2 groups or ≥ 3 groups, respectively. *P < .05, **P < .01, and ***P < .001. Bars indicate the median.
Figure 7
Figure 7
Exhausted lymphopoiesis and persistent CD4+ T-cell count decline. Circulating CD34+, lymphoid HPCs, naive CD4+ T-cell, or CD8+ T-, B-, and NK-cell counts and percentages of CD38+ memory CD8+ T cells are shown for one donor at 2 different time points to highlight the association between declining CD4+ T-cell counts and exhaustion of lymphopoietic capacity despite low viral load before and after initiation of ART.

References

    1. Giorgi JV, Hultin LE, McKeating JA, et al. Shorter survival in advanced human immunodeficiency virus type 1 infection is more closely associated with T lymphocyte activation than with plasma virus burden or virus chemokine coreceptor usage. J Infect Dis. 1999;179(4):859–870. - PubMed
    1. Hazenberg MD, Hamann D, Schuitemaker H, Miedema F. T cell depletion in HIV-1 infection: how CD4+ T cells go out of stock. Nat Immunol. 2000;1(4):285–289. - PubMed
    1. Grossman Z, Meier-Schellersheim M, Sousa AE, Victorino RM, Paul WE. CD4+ T-cell depletion in HIV infection: are we closer to understanding the cause? Nat Med. 2002;8(4):319–323. - PubMed
    1. Hazenberg MD, Otto SA, van Benthem BH, et al. Persistent immune activation in HIV-1 infection is associated with progression to AIDS. AIDS. 2003;17(13):1881–1888. - PubMed
    1. Deeks SG, Kitchen CM, Liu L, et al. Immune activation set point during early HIV infection predicts subsequent CD4+ T-cell changes independent of viral load. Blood. 2004;104(4):942–947. - PubMed

Publication types