. 2011 Jun;259(3):775-84.
doi: 10.1148/radiol.11102066. Epub 2011 Mar 24.

Diffusion-weighted endorectal MR imaging at 3 T for prostate cancer: tumor detection and assessment of aggressiveness

Affiliations

Diffusion-weighted endorectal MR imaging at 3 T for prostate cancer: tumor detection and assessment of aggressiveness

Hebert Alberto Vargas et al. Radiology. 2011 Jun.

Abstract

Purpose: To assess the incremental value of diffusion-weighted (DW) magnetic resonance (MR) imaging over T2-weighted MR imaging at 3 T for prostate cancer detection and to investigate the use of the apparent diffusion coefficient (ADC) to characterize tumor aggressiveness, with whole-mount step-section pathologic analysis as the reference standard.

Materials and methods: The Internal Review Board approved this HIPAA-compliant retrospective study and waived informed consent. Fifty-one patients with prostate cancer (median age, 58 years; range, 46-74 years) underwent T2-weighted MR imaging and DW MR imaging (b values: 0 and 700 sec/mm(2) [n = 20] or 0 and 1000 sec/mm(2) [n = 31]) followed by prostatectomy. The prostate was divided into 12 regions; two readers provided a score for each region according to their level of suspicion for the presence of cancer on a five-point scale, first using T2-weighted MR imaging alone and then using T2-weighted MR imaging and the ADC map in conjunction. Areas under the receiver operating characteristic curve (AUCs) were estimated to evaluate performance. Generalized estimating equations were used to test the ADC difference between benign and malignant prostate regions and the association between ADCs and tumor Gleason scores.

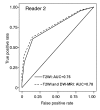
Results: For tumor detection, the AUCs for readers 1 and 2 were 0.79 and 0.76, respectively, for T2-weighted MR imaging and 0.79 and 0.78, respectively, for T2-weighted MR imaging plus the ADC map. Mean ADCs for both cancerous and healthy prostatic regions were lower when DW MR imaging was performed with a b value of 1000 sec/mm(2) rather than 700 sec/mm(2). Regardless of the b value used, there was a significant difference in the mean ADC between malignant and benign prostate regions. A lower mean ADC was significantly associated with a higher tumor Gleason score (mean ADCs of [1.21, 1.10, 0.87, and 0.69] × 10(-3) mm(2)/sec were associated with Gleason score of 3 + 3, 3 + 4, 4 + 3, and 8 or higher, respectively; P = .017).

Conclusion: Combined DW and T2-weighted MR imaging had similar performance to T2-weighted MR imaging alone for tumor detection; however, DW MR imaging provided additional quantitative information that significantly correlated with prostate cancer aggressiveness.


Figures

Figure 1:
Figure 1:
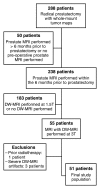
Flowchart summarizing patient selection. DW-MRI = DW MR imaging.
Figure 2a:
Figure 2a:
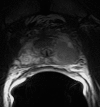
Gleason score 7 (4 + 3) tumor of the left prostatic apex in a 65-year-old patient is seen as (a) a homogeneous focus of low signal intensity on a transverse T2-weighted MR image (3516/122) and (b) a focus of restricted diffusion on the ADC map (3500/76.3; b value, 700 sec/mm2).
Figure 2b:
Figure 2b:
Gleason score 7 (4 + 3) tumor of the left prostatic apex in a 65-year-old patient is seen as (a) a homogeneous focus of low signal intensity on a transverse T2-weighted MR image (3516/122) and (b) a focus of restricted diffusion on the ADC map (3500/76.3; b value, 700 sec/mm2).
Figure 3a:
Figure 3a:
Receiver operating characteristic curves and AUCs for readers (a) 1 and (b) 2 for detection and localization of prostate cancer by using T2-weighted MR imaging (T2WI) with or without DW MR imaging (DW-MRI).
Figure 3b:
Figure 3b:
Receiver operating characteristic curves and AUCs for readers (a) 1 and (b) 2 for detection and localization of prostate cancer by using T2-weighted MR imaging (T2WI) with or without DW MR imaging (DW-MRI).
Figure 4a:
Figure 4a:
Images from a 67-year-old patient with prostate cancer. No definite abnormality was seen on either the (a) T2-weighted MR image (3500/118) or (b) ADC map (3500/87.5; b = 700 sec/mm2). (c) A representative image from step-section pathologic analysis shows tumor foci (outlined in green, Gleason 3 + 3) in right and left peripheral zones. (Hematoxylin-eosin stain; original magnification, ×1.05.)
Figure 4b:
Figure 4b:
Images from a 67-year-old patient with prostate cancer. No definite abnormality was seen on either the (a) T2-weighted MR image (3500/118) or (b) ADC map (3500/87.5; b = 700 sec/mm2). (c) A representative image from step-section pathologic analysis shows tumor foci (outlined in green, Gleason 3 + 3) in right and left peripheral zones. (Hematoxylin-eosin stain; original magnification, ×1.05.)
Figure 4c:
Figure 4c:
Images from a 67-year-old patient with prostate cancer. No definite abnormality was seen on either the (a) T2-weighted MR image (3500/118) or (b) ADC map (3500/87.5; b = 700 sec/mm2). (c) A representative image from step-section pathologic analysis shows tumor foci (outlined in green, Gleason 3 + 3) in right and left peripheral zones. (Hematoxylin-eosin stain; original magnification, ×1.05.)
Figure 5a:
Figure 5a:
Box and whisker plots show ADCs (in mm2/sec [mm2/s]) of prostate cancer lesions (Lesion) and healthy prostate tissue (Normal) at b values of 700 and 1000 sec/mm2 (s/mm2) for readers (a) 1 and (b) 2. Center line = median, top of box = 75th percentile, bottom of box = 25th percentile, whiskers = 10th and 90th percentiles, ● = outlier.
Figure 5b:
Figure 5b:
Box and whisker plots show ADCs (in mm2/sec [mm2/s]) of prostate cancer lesions (Lesion) and healthy prostate tissue (Normal) at b values of 700 and 1000 sec/mm2 (s/mm2) for readers (a) 1 and (b) 2. Center line = median, top of box = 75th percentile, bottom of box = 25th percentile, whiskers = 10th and 90th percentiles, ● = outlier.
Figure 6a:
Figure 6a:
Box and whisker plots show (a) ADCs (in mm2/sec [mm2/s]) and (b) ADC ratios of lesions detected on ADC maps stratified by Gleason score. Center line = median, + = mean, top of box = 75th percentile, bottom of box = 25th percentile, whiskers = 10th and 90th percentiles, ● = outlier. Ref = reference value, SE = standard error.
Figure 6b:
Figure 6b:
Box and whisker plots show (a) ADCs (in mm2/sec [mm2/s]) and (b) ADC ratios of lesions detected on ADC maps stratified by Gleason score. Center line = median, + = mean, top of box = 75th percentile, bottom of box = 25th percentile, whiskers = 10th and 90th percentiles, ● = outlier. Ref = reference value, SE = standard error.

References

    1. Jemal A, Siegel R, Xu J, Ward E. Cancer statistics, 2010. CA Cancer J Clin 2010;60(5):277–300 - PubMed
    1. Akin O, Hricak H. Imaging of prostate cancer. Radiol Clin North Am 2007;45(1):207–222 - PubMed
    1. Fuchsjäger M, Akin O, Shukla-Dave A, Pucar D, Hricak H. The role of MRI and MRSI in diagnosis, treatment selection, and post-treatment follow-up for prostate cancer. Clin Adv Hematol Oncol 2009;7(3):193–202 - PubMed
    1. Turkbey B, Albert PS, Kurdziel K, Choyke PL. Imaging localized prostate cancer: current approaches and new developments. AJR Am J Roentgenol 2009;192(6):1471–1480 - PMC - PubMed
    1. Kurhanewicz J, Vigneron D, Carroll P, Coakley F. Multiparametric magnetic resonance imaging in prostate cancer: present and future. Curr Opin Urol 2008;18(1):71–77 - PMC - PubMed

Publication types