. 2011 Jun;25(6):1027-39.
doi: 10.1210/me.2010-0387. Epub 2011 Mar 24.

Characterization of a MAPK scaffolding protein logic gate in gonadotropes

Affiliations

Characterization of a MAPK scaffolding protein logic gate in gonadotropes

Soon Gang Choi et al. Mol Endocrinol. 2011 Jun.

Abstract

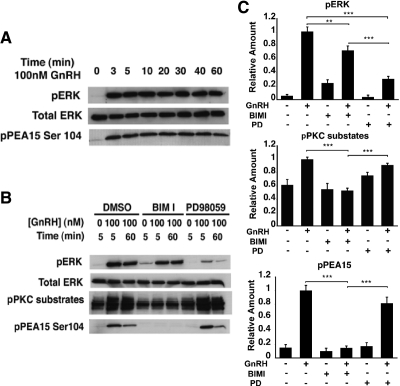
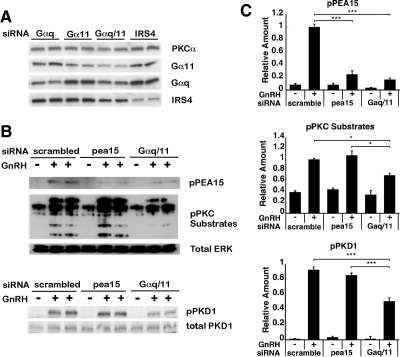
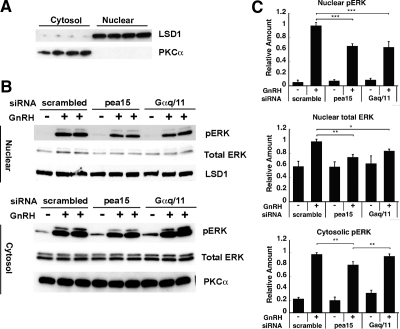
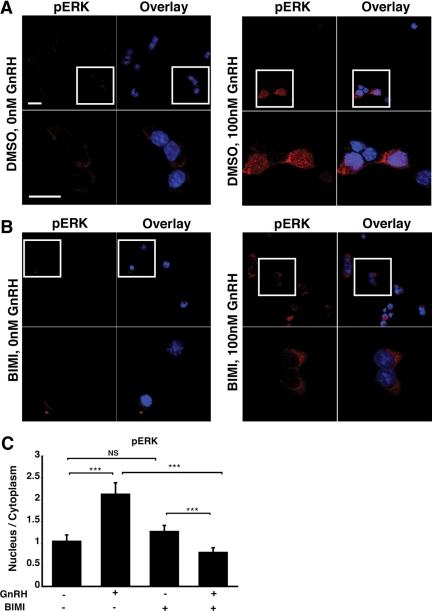
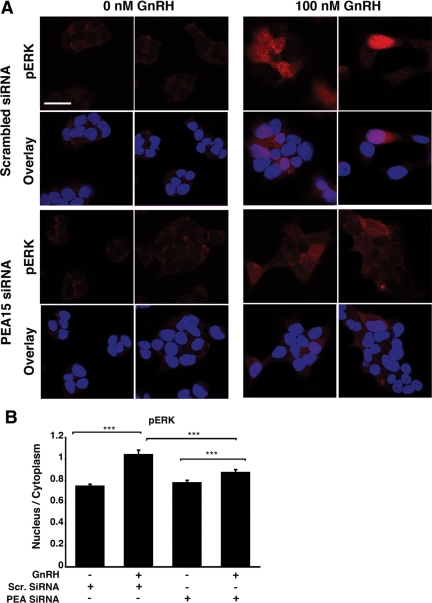
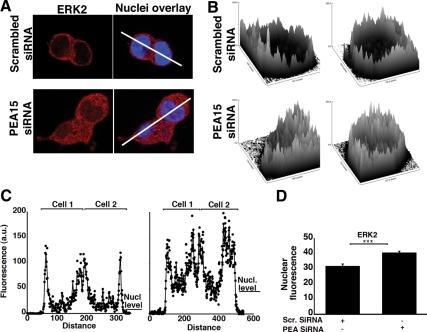
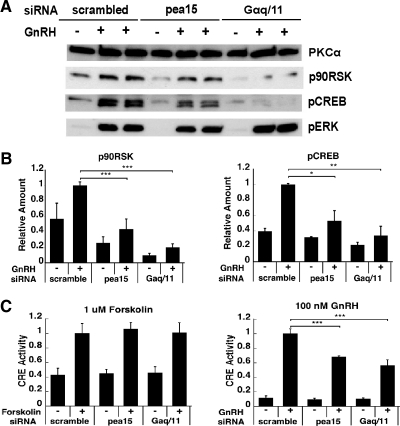
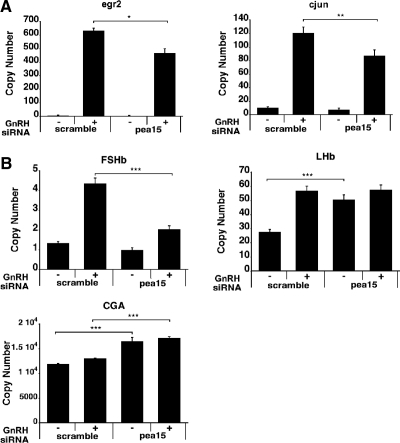
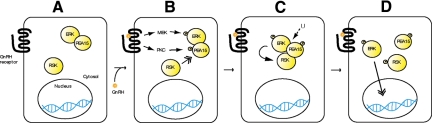
In the pituitary gonadotropes, both protein kinase C (PKC) and MAPK/ERK signaling cascades are activated by GnRH. Phosphoprotein-enriched in astrocytes 15 (PEA-15) is a cytosolic ERK scaffolding protein, which is expressed in LβT2 gonadotrope cells. Pharmacological inhibition of PKC and small interfering RNA-mediated silencing of Gαq/11 revealed that GnRH induces accumulation of phosphorylated PEA-15 in a PKC-dependent manner. To investigate the potential role of PEA-15 in GnRH signaling, we examined the regulation of ERK subcellular localization and the activation of ribosomal S6 kinase, a substrate of ERK. Results obtained by cellular fractionation/Western blot analysis and immunohistochemistry revealed that GnRH-induced accumulation of phosphorylated ERK in the nucleus was attenuated when PEA-15 expression was reduced. Conversely, in the absence of GnRH stimulation, PEA-15 anchors ERK in the cytosol. Our data suggest that GnRH-induced nuclear translocation of ERK requires its release from PEA-15, which occurs upon PEA-15 phosphorylation by PKC. Additional gene-silencing experiments in GnRH-stimulated cells demonstrated that ribosomal S6 kinase activation was dependent on both PEA-15 and PKC. Furthermore, small interfering RNA-mediated knockdown of PEA-15 caused a reduction in GnRH-stimulated expression of early response genes Egr2 and c-Jun, as well as gonadotropin FSHβ-subunit gene expression. PEA-15 knockdown increased LHβ and common α-glycoprotein subunit mRNAs, suggesting a possible role in differential regulation of gonadotropin subunit gene expression. We propose that PEA-15 represents a novel point of convergence of the PKC and MAPK/ERK pathways under GnRH stimulation. PKC, ERK, and PEA-15 form an AND logic gate that shapes the response of the gonadotrope cell to GnRH.


Figures

Fig. 1.
Fig. 1.
GnRH induces PEA-15 phosphorylation via PKC in LβT2 cells. A, Time course of GnRH-stimulated ERK and PEA-15 activation in LβT2 cells. Total ERK was used as a loading control. LβT2 cells were serum starved overnight before treatment with 100 nm GnRH for the indicated periods of time. Whole-cell lysates were subjected to a Western blot analysis using phospho-ERK- and phospho-PEA-15 (Ser104)-specific antibodies. Total ERK was used as a loading control. B, Effect of pharmacological inhibitors on GnRH-induced ERK and PEA-15 activation. LβT2 cells were serum starved overnight, pretreated with the following inhibitors for 30 min: 10 μm BIMI or 50 μm PD98059 and stimulated with 100 nm GnRH for either 5 or 60 min. Whole-cell lysates were subjected to a Western blot analysis using phospho-ERK-, phospho-PKC substrates, and phospho-PEA-15 (Ser104)-specific antibodies. Total ERK was used as a loading control. C, Quantification of Western blot (B) densitometry, plotted as mean ± sem. Results of triplicate experiments were combined for analysis. The y-axis shows band intensities relative to the positive control (no inhibitor, + GnRH). Two-way ANOVA; ***, P <0.005, **, P <0.01. PD, PD98059.
Fig. 2.
Fig. 2.
Effect of siRNA-mediated silencing of PEA-15 and Gαq/11 on GnRH-induced PEA-15 phosphorylation and PKC activity. A, Knockdown efficiency of Gα proteins in LβT2 cells. The LβT2 cells were transfected with Gαq, Gα11, Gαq/11, or IRS4 siRNA using the nucleofection method, as described in Materials and Methods. Whole-cell lysates were subjected to a Western blot analysis using Gα11-, Gαq-, and IRS4-specific antibodies. PKCα was used as loading control. B, LβT2 cells were serum starved overnight, transfected with scrambled, PEA-15, or Gαq/11 siRNA and stimulated with 100 nm GnRH for 5 min. Whole-cell lysates were subjected to a Western blot analysis using phospho-PEA-15- and phospho-PKC substrate-specific antibodies (upper blot) or using a phospho-PKD1-specific antibody (lower blot). Total ERK and total PKD1 were used as loading controls for the upper and the lower blots, respectively. C, Quantification of Western blot (B) densitometry, plotted as mean ± sem. Results of triplicate experiments were combined for analysis. The y-axis shows band intensities relative to the positive control (scrambled siRNA, + GnRH). Two-way ANOVA, n = 8; ***, P < 0.005; *, P < 0.05.
Fig. 3.
Fig. 3.
Effect of PEA-15 and Gαq/11 silencing on GnRH-induced ERK activation in the nucleus vs. cytosol. A, Isolation of the nuclear and cytoplasmic fractions of LβT2 cells. Cells were fractionated into nuclear and cytosolic extracts. Aliquots of the nuclear and cytoplasmic fractions were subjected to a Western blot analysis using an LSD1- and a PKCα-specific antibody, respectively. LSD1 is a nuclear marker; PKCα is a cytosolic marker. B, LβT2 cells were serum starved overnight, transfected with scrambled, PEA-15, or Gαq/11 siRNA and stimulated with 100 nm GnRH for 5 min. Cells were fractionated into nuclear and cytoplasmic extracts, and the aliquots of the nuclear and the cytoplasmic fractions were subjected to a Western blot analysis using phospho-ERK and LSD1-specific antibodies (upper blot) or using phospho-ERK- and PKCα-specific antibodies (lower blot). LSD1 was used as a loading control for the upper blot, whereas PKCα was used in the lower blot. C, Quantification of Western blot (B) densitometry, plotted as mean ± sem. Results of triplicate experiments were combined for analysis. The y-axis shows band intensities relative to the positive control (scrambled siRNA, + GnRH). Two-way ANOVA, n = 8; ***, P < 0.005; **, P < 0.01; *, P < 0.05.
Fig. 4.
Fig. 4.
GnRH-induced accumulation of phospho-ERK in the nucleus is PKC- dependent. LβT2 cells were serum starved overnight, pretreated with either dimethyl sulfoxide (DMSO) (A) or 10 μm BIMI (B) for 30 min and stimulated or not with 100 nm GnRH for 5 min. Cells were then fixed and stained with an anti-phospho-ERK antibody (red) and DAPI (blue), as indicated in Materials and Methods. The boxed areas are shown at high magnification. Scale bar, 20 μm. C, Single-cell quantification of phospho-ERK fluorescence using the 3D-CatFISH image analysis suite (70, 71). The y-axis displays the nucleus to cytoplasm fluorescence ratio. NS, Nonsignificant. Two-way ANOVA; ***, P < 0.005.
Fig. 5.
Fig. 5.
Effect of PEA-15 silencing on GnRH-induced nuclear accumulation of phospho-ERK. A, LβT2 cells were serum starved overnight, transfected with either scrambled (top panel) or PEA-15 siRNA (bottom panel) and stimulated or not with 100 nm GnRH for 5 min. Cells were then fixed and stained with an anti-phospho-ERK antibody (red) and DAPI (blue), as described in Materials and Methods. B, Single-cell quantification of phospho-ERK fluorescence using the 3D-CatFISH image analysis suite (70, 71). The y-axis displays the nucleus to cytoplasm fluorescence ratio. ANOVA, n = 62; ***, P < 0.005. Single-cell fluorescence distribution is also presented in Supplemental Fig. 5 (using GFP siRNA as a control) and Supplemental Fig. 6 (using scrambled siRNA as a control). Scr, Scrambled.
Fig. 6.
Fig. 6.
PEA-15 impedes the accumulation of ERK in the nucleus of nonstimulated cells. A, Resting LβT2 cells were transfected with either scrambled or PEA-15 siRNA. The cells were then fixed and stained with an anti-ERK2 antibody (red) and DAPI (blue), as described in Materials and Methods. White lines identify cross-sections in which fluorescence signal intensity was quantified in C. B, Surface plot analysis of ERK2 fluorescence from A using the Image J image processing program (NIH). C, Quantification of ERK2 fluorescence in the cross-sections indicated in A, using the Image J image processing program. Left plot, Scrambled siRNA; right plot, PEA-15 siRNA. D, Single-cell quantification of ERK2 nuclear fluorescence using the 3D-CatFISH image analysis suite (70, 71). Student t test, n = 102; ***, P < 0.005. Single-cell fluorescence distribution is also presented in Supplemental Fig. 7.
Fig. 7.
Fig. 7.
Effect of PEA-15 and Gαq/11 silencing on GnRH-induced RSK activation. A, LβT2 cells were serum starved overnight, transfected with scrambled, PEA-15, or Gαq/11 siRNA and stimulated or not with 100 nm GnRH for 5 min. Whole-cell lysates were subjected to a Western blot analysis using phospho-CREB-, phospho-RSK-, and phospho-ERK-specific antibodies. PKCα was used as a loading control. The small reductions in basal phospho-CREB and phospho-RSK seen in the blot shown were not reproducible in multiple experiments. B, Quantification of Western blot (A) densitometry, plotted as mean ± sem. The results of triplicate experiments were combined for analysis. The y-axis shows band intensities relative to positive control (scrambled siRNA, + GnRH). For GnRH-stimulated conditions: two-way ANOVA, n = 6; ***, P < 0.005; **, P < 0.01; *, P < 0.05; for basal conditions, two-way ANOVA, n = 3. C, Effects of PEA-15 and Gαq/11 knockdowns on CRE reporter activity. After being serum starved overnight, LβT2 cells were cotransfected with scrambled, PEA-15, or Gαq/11 siRNA, a CRE Firefly luciferase reporter plasmid and a thymidine kinase-Renilla luciferase reporter plasmid and stimulated with either 1 μm forskolin or 100 nm GnRH for 6 h. Results are presented as the average of two experiments, calculated as Firefly/Renilla luciferase activity, and plotted as mean ± sem. Two-way ANOVA, n = 10; ***, P < 0.005.
Fig. 8.
Fig. 8.
Downstream effects of PEA-15 knockdown in GnRH-stimulated cells. A, Effect of PEA-15 knockdown on early response gene expression. LβT2 cells were serum starved overnight, transfected with either scrambled or PEA-15 siRNA, and stimulated or not with 1 nm GnRH for 45 min. Transfections were carried out in the Nucleofector 96-well shuttle using the cell line optimization 96-well nucleofector kit (SG nucleoporation buffer) and nucleofector program DS-137 (Lonza Walkersville Inc.). The RNA copy numbers of Egr2 and c-Jun were determined by qPCR. Student t test, n = 4; **, P < 0.01; *, P < 0.05. B, Effect of PEA-15 knockdown on gonadotropin subunit gene expression. LβT2 cells were serum starved overnight, transfected with either scrambled or PEA-15 siRNA, and stimulated or not with 1 nm GnRH for 2 h; the medium was then removed and replaced with fresh medium to remove GnRH, and cells were incubated for another 4 h. Transfections were carried out in the nucleofector 96-well shuttle using the cell line optimization 96-well nucleofector kit (SG nucleoporation buffer) and nucleofector program DS-137 (Lonza Walkersville Inc.). RNA copy numbers of FSHβ, LHβ, and CGA were determined by qPCR. Two-way ANOVA, n = 12; ***, P < 0.005.
Fig. 9.
Fig. 9.
Proposed model for PEA-15 mediation of ERK nuclear translocation and RSK activation. A, In resting gonadotrope cells, PEA-15 and ERK interact, retaining ERK in the cytoplasm. B, GnRH stimulation leads to the independent activation of the PKC and ERK pathways. PKC phosphorylates PEA-15, and its phosphorylation recruits RSK to PEA-15. C, The recruitment of RSK to PEA-15 increases the local concentration of RSK in the vicinity of ERK, thereby promoting RSK phosphorylation by ERK. D, After RSK phosphorylation, ERK dissociates from the RSK-PEA-15 complex and enters the nucleus, activating its nuclear substrates, which include ELK1. The activated RSK translocates to the nucleus, in which it phosphorylates its own substrates CREB and activating transcription factor 1. U, Unknown factor(s).

Similar articles

Cited by

References

    1. Alarid ET, Windle JJ, Whyte DB, Mellon PL. 1996. Immortalization of pituitary cells at discrete stages of development by directed oncogenesis in transgenic mice. Development 122:3319–3329 - PubMed
    1. Pernasetti F, Vasilyev VV, Rosenberg SB, Bailey JS, Huang HJ, Miller WL, Mellon PL. 2001. Cell-specific transcriptional regulation of follicle-stimulating hormone-β by activin and gonadotropin-releasing hormone in the LβT2 pituitary gonadotrope cell model. Endocrinology 142:2284–2295 - PubMed
    1. Thomas P, Mellon PL, Turgeon J, Waring DW. 1996. The LβT2 clonal gonadotrope: a model for single cell studies of endocrine cell secretion. Endocrinology 137:2979–2989 - PubMed
    1. Turgeon JL, Kimura Y, Waring DW, Mellon PL. 1996. Steroid and pulsatile gonadotropin-releasing hormone (GnRH) regulation of luteinizing hormone and GnRH receptor in a novel gonadotrope cell line. Mol Endocrinol 10:439–450 - PubMed
    1. Windle JJ, Weiner RI, Mellon PL. 1990. Cell lines of the pituitary gonadotrope lineage derived by targeted oncogenesis in transgenic mice. Mol Endocrinol 4:597–603 - PubMed

Publication types

MeSH terms

Substances