. 2011 Apr;121(4):1484-96.
doi: 10.1172/JCI45232. Epub 2011 Mar 23.

Mouse and human neutrophils induce anaphylaxis

Affiliations

Mouse and human neutrophils induce anaphylaxis

Friederike Jönsson et al. J Clin Invest. 2011 Apr.

Abstract

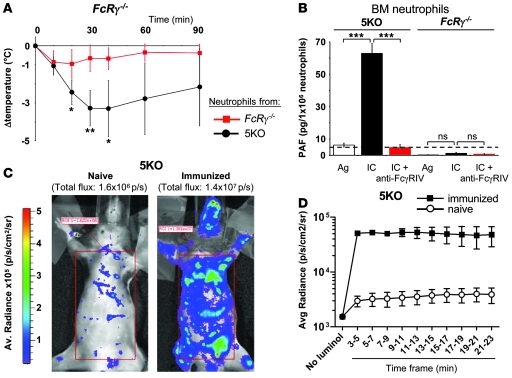
Anaphylaxis is a life-threatening hyperacute immediate hypersensitivity reaction. Classically, it depends on IgE, FcεRI, mast cells, and histamine. However, anaphylaxis can also be induced by IgG antibodies, and an IgG1-induced passive type of systemic anaphylaxis has been reported to depend on basophils. In addition, it was found that neither mast cells nor basophils were required in mouse models of active systemic anaphylaxis. Therefore, we investigated what antibodies, receptors, and cells are involved in active systemic anaphylaxis in mice. We found that IgG antibodies, FcγRIIIA and FcγRIV, platelet-activating factor, neutrophils, and, to a lesser extent, basophils were involved. Neutrophil activation could be monitored in vivo during anaphylaxis. Neutrophil depletion inhibited active, and also passive, systemic anaphylaxis. Importantly, mouse and human neutrophils each restored anaphylaxis in anaphylaxis-resistant mice, demonstrating that neutrophils are sufficient to induce anaphylaxis in mice and suggesting that neutrophils can contribute to anaphylaxis in humans. Our results therefore reveal an unexpected role for IgG, IgG receptors, and neutrophils in anaphylaxis in mice. These molecules and cells could be potential new targets for the development of anaphylaxis therapeutics if the same mechanism is responsible for anaphylaxis in humans.


Figures

Figure 1
Figure 1. Neutrophils mediate FcγRIV-dependent active anaphylaxis.
Indicated mice were immunized and challenged with BSA. Central temperatures and survival rates were monitored. (A) ASA in WT (n = 4), FcγRIIIA–/– (n = 5), and FcεRI/II–/– (n = 4) mice. (B) ASA in WT (n = 9) and 5KO mice (n = 7). (C) ASA in 5KO mice injected with anti-FcγRIV mAbs (n = 10) or isotype control (n = 11) before BSA challenge. (D) Representative expression of FcγRIV on mouse blood and peritoneal cells: B cells (CD19+), T cells (CD4+), monocytes (mono.) (CD11b+Gr1), neutrophils (neutro.) (CD11b+Gr1+), basophils (baso.) (IgE+DX5+), eosinophils (eosino.) (Gr1+SiglecF+), macrophages (macro.) (CD11b+Gr1), and mast cells (IgE+CD117+). (E and F) ASA in 5KO mice injected with (E) PBS liposomes (lipo.) (n = 7) or clodronate liposomes (n = 8), (F) anti-Gr1 mAbs (n = 8) or isotype (iso.) control (n = 9) before BSA challenge. Data are a compilation of 2 experiments. Note that both PBS and clodronate liposome injections inhibited ASA-associated mortality. (G) Immunized 5KO mice were injected with anti-Gr1 mAbs or isotype control on day 0, challenged with BSA on day +1, retroorbitally bled on days +2 and +6, but otherwise left untouched until rechallenged with BSA on day +7. Upper panel: representative density plots of blood leukocytes stained as indicated. Percentages of Gr1hiCD11bhi cells (neutrophils) are indicated. Lower panel: ASA in immunized 5KO mice at day +7 after depletion (Iso, n = 3; anti-Gr1, n = 4). (AC and EG) Data are represented as mean ± SEM. (AF) Data are representative from at least 2 independent experiments (A, 2; B, 5; C, 4; D, 3; E, 2; and F, 4 experiments). ***P < 0.001. X’s represent mortality in the 100% experimental group.
Figure 2
Figure 2. Neutrophil transfer restores ASA, and neutrophils are immediately and systemically activated during ASA.
(A) BSA-immunized FcRγ–/– mice were injected i.v. with neutrophils from FcRγ–/– mice (n = 4) or from 5KO mice (n = 5), challenged with BSA, and central temperatures measured. Statistical differences are indicated for each time point if significant. Note that no mortality was observed during this experiment. (B) Purified bone marrow neutrophils from 5KO or FcRγ–/– mice were stimulated with antigen alone (Ag) or with IgG IC, or preincubated with anti-FcγRIV Abs before stimulation with IC (IC plus anti-FcγRIV), and PAF concentration was determined in culture supernatants. Means of triplicates are represented. (C) Naive or BSA-immunized 5KO mice were anesthetized, challenged with BSA (t = 0), and injected with luminol (t = 5 minutes). Representative images show color-coded maps of photon flux superimposed on black and white photographs of mice (15- to 20-minute time frame after challenge) (n = 2). (D) Time course of photon fluxes from naive and BSA-immunized 5KO mice (n = 3) following BSA challenge (t = 0). (A and D) Data are represented as mean ± SEM. (C and D) Data are representative from 2 independent experiments. *P < 0.05; **P < 0.01; ***P < 0.001.
Figure 3
Figure 3. Neutrophils and FcγRIV account for IgG2b-IC induced PSA in WT mice, and neutrophils account for GPI/anti-GPI–PSA in WT mice.
(A, B, and D) Indicated mice were injected with preformed IgG2b-IC (monoclonal IgG2b anti-DNP mAb plus DNP-HSA), and central temperatures were monitored (A, n = 4; B, n = 3; D, n = 3). (C) 5KO mice were preinjected or not with anti-FcγRIV Abs before challenge with IgG2b-IC. Plasma was collected 20 minutes after challenge, and PAF concentration was determined. Means of triplicates are represented. (EI) Mice were injected with indicated mAbs or isotype controls before injection of preformed polyclonal IgG-IC (GPI/anti-GPI). Central temperatures were monitored (E, n = 4; F, n = 4; G, n = 5; H, n = 4; I, n = 4). (G) Statistical differences between the untreated and the anti-Gr1–treated groups are indicated for each time point if significant. (AI) Data are represented as mean ± SEM. (A, B, and DI) Data are representative of 2 independent experiments. Note that no mortality was observed in all these experiments. *P < 0.05; **P < 0.01; ***P < 0.001.
Figure 4
Figure 4. FcγRIIIA and FcγRIV account for ASA in WT mice.
(A) Representative density plots of CD11b and FcγRIIIA expression on blood leukocytes from WT or FcγRIIIA–/– mice. (B) FcγRIIB–/– mice or FcγRIIB/IIIA–/– double-deficient mice were injected with anti-FcγRIIIA mAb or not before injection with IgG1-IC (n = 3). Central temperatures were monitored. Statistical differences between groups treated with 0 and 25 μg and those treated with 0 and 50 μg are indicated under and over the horizontal axis, respectively, for each time point if significant. (CE) Indicated mice were immunized and challenged with BSA. Central temperatures and survival rates were monitored. (C) ASA in WT mice injected with anti-FcγRIIIA (n = 5) or vehicle (n = 3) before BSA challenge. (D) ASA in WT mice injected with vehicle (n = 8), anti-FcγRIIIA mAbs (n = 7), anti-FcγRIV mAbs (n = 8), or both mAbs (n = 7). Statistical differences between the vehicle-treated group and each experimental group are indicated at the right end of each curve. (E) ASA in WT mice injected with indicated mAbs before BSA challenge (n = 4). (AE) Data are represented as mean ± SEM and are representative of 2 independent experiments. *P < 0.05; **P < 0.01; ***P < 0.001. X’s represent 100% mortality in the vehicle group.
Figure 5
Figure 5. Neutrophils and basophils contribute to active anaphylaxis in WT mice.
(A) Representative histogram plots of FcγRIIIA expression in WT mice on cell populations identified as in Figure 1D. (BE) Indicated mice were immunized against BSA and challenged with BSA. Central temperatures and survival rates were monitored. (B) WT mice were injected with gadolinium or vehicle before BSA challenge (n = 4). (C) WT mice were injected with anti-Gr1, anti-CD200R3, anti-Gr1 plus anti-CD200R3 mAbs (n = 4), or isotype controls (n = 5) before BSA challenge. Survival of the isotype-treated group is statistically different from the anti-Gr1 and from the anti-Gr1 plus anti-CD200R3 groups (P < 0.05), but not from the anti-CD200R3 group. (D) Wsh mice were injected with anti-CD200R3 (top: n = 3; bottom: n = 4), anti-Gr1 (top: n = 4), anti-Gr1 plus anti-CD200R3 (top: n = 5; bottom: n = 4) mAbs, or isotype controls (top: n = 4; bottom: n = 3) before BSA challenge. (E) FcγRIIIA–/– mice injected with anti-Gr1 mAbs or isotype control before BSA challenge (n = 5). (BE) Data are represented as mean ± SEM. (AE) Data are representative of 2 independent experiments. **P < 0.01. X’s represent 100% mortality in the experimental group.
Figure 6
Figure 6. High neutrophil numbers are not responsible for the predominant contribution of neutrophils to ASA.
(A) WT mice were left untreated (naive, n = 7) or were injected 3 times with BSA in the indicated adjuvant (CFA/IFA, n = 5; alum plus PTX, n = 4; alum, n = 8) or 1 time only with BSA in alum (n = 10). The proportion of granulocytes among wbc and the absolute granulocyte counts in blood 7 days after the last immunization is represented as individual results and mean. PTX, pertussis toxin. (B and C) Absolute granulocyte counts (B) and anti-BSA antibody levels (C) in blood of 5KO mice over time after the last immunization (t = 0) in CFA/IFA (n = 8). (D) Mice from B and C were injected with indicated mAbs and challenged with BSA 7 weeks after the last immunization (n = 4). Statistical significance is indicated. (BD) Data are represented as mean ± SEM. *P < 0.05; **P < 0.01; ***P < 0.001.
Figure 7
Figure 7. PAF mediates neutrophil-dependent active anaphylaxis.
Indicated mice were immunized and challenged with BSA. Central temperatures and survival rates were monitored. (A and B) ASA in 5KO mice injected (A) with vehicle or indicated PAF-R antagonists (n = 4) or (B) with vehicle or cyproheptadine (n = 4) before BSA challenge. (C) ASA in WT mice injected with ABT-491, cyproheptadine, or vehicle before BSA challenge (n = 3). (D) ASA in cPla2–/– mice (n = 5) or heterozygous littermate controls (n = 8). (AD) Data are represented as mean ± SEM and are representative of 2 independent experiments. X’s represent 100% mortality in the experimental group.
Figure 8
Figure 8. Human neutrophils restore anaphylaxis in resistant mice.
(A) Representative histogram plots of human FcR expression on purified human neutrophils. (B) Histograms show the binding of indicated IgG IC or anti-FLAG mAbs (FLAG) to indicated FLAG-tagged FcγR+ CHO transfectants. Both polymorphic variants of human FcγRIIA at position 131 are used and represented. All human FcγRIIIB variants (NA1, NA2, and SH) gave identical results; only variant NA1 is represented. (C) Expression of CD62L on purified human neutrophils from healthy donors incubated with GPI/anti-GPI IC (n = 5) and controls. Data represent individual results and means. (D) FcRγ–/– mice were immunized with BSA, injected or not with 2 × 10⁶ human neutrophils, challenged with BSA, and central temperatures monitored (n = 3). Data are represented as mean ± SEM. Statistical differences are indicated. (E and F) Purified human neutrophils originating from 1 healthy donor were divided equally in 2 fractions. One fraction was injected into a naive (open symbols) and 1 fraction into a BSA-immunized FcRγ–/– mice (closed symbols) at (E) 7.5 × 10⁵ neutrophils per mouse (n = 3) or (F) 1.5 × 10⁶ neutrophils per mouse (n = 2). Mice were subsequently challenged with BSA and central temperatures were monitored. Each symbol corresponds to the pair of mice that received neutrophils from 1 specific donor. *P < 0.05; **P < 0.01; ***P < 0.001.

Comment in

  • Neutrophils give us a shock.
    Lowell CA. Lowell CA. J Clin Invest. 2011 Apr;121(4):1260-3. doi: 10.1172/JCI57296. Epub 2011 Mar 23. J Clin Invest. 2011. PMID: 21436575 Free PMC article.
  • Allergy: shocking behaviour.
    Bordon Y. Bordon Y. Nat Rev Immunol. 2011 May;11(5):302-3. doi: 10.1038/nri2980. Nat Rev Immunol. 2011. PMID: 21508976 No abstract available.

Similar articles

Cited by

References

    1. Galli SJ. Pathogenesis and management of anaphylaxis: current status and future challenges. J Allergy Clin Immunol. 2005;115(3):571–574. doi: 10.1016/j.jaci.2004.12.1133. - DOI - PubMed
    1. Neugut AI, Ghatak AT, Miller RL. Anaphylaxis in the United States: an investigation into its epidemiology. Arch Intern Med. 2001;161(1):15–21. doi: 10.1001/archinte.161.1.15. - DOI - PubMed
    1. Portier P, Richet C. De l’action anaphylactique de certain venins. CR Soc Biol (Paris). 1902;54:170.
    1. Dombrowicz D, Flamand V, Brigman KK, Koller BH, Kinet JP. Abolition of anaphylaxis by targeted disruption of the high affinity immunoglobulin E receptor alpha chain gene. Cell. 1993;75(5):969–976. doi: 10.1016/0092-8674(93)90540-7. - DOI - PubMed
    1. Miyajima I, Dombrowicz D, Martin TR, Ravetch JV, Kinet JP, Galli SJ. Systemic anaphylaxis in the mouse can be mediated largely through IgG1 and Fc gammaRIII. Assessment of the cardiopulmonary changes, mast cell degranulation, and death associated with active or IgE- or IgG1-dependent passive anaphylaxis. J Clin Invest. 1997;99(5):901–914. doi: 10.1172/JCI119255. - DOI - PMC - PubMed

Publication types