. 2011 Apr;121(4):1313-28.
doi: 10.1172/JCI42405. Epub 2011 Mar 23.

Upregulated stromal EGFR and vascular remodeling in mouse xenograft models of angiogenesis inhibitor-resistant human lung adenocarcinoma

Affiliations

Upregulated stromal EGFR and vascular remodeling in mouse xenograft models of angiogenesis inhibitor-resistant human lung adenocarcinoma

Tina Cascone et al. J Clin Invest. 2011 Apr.

Abstract

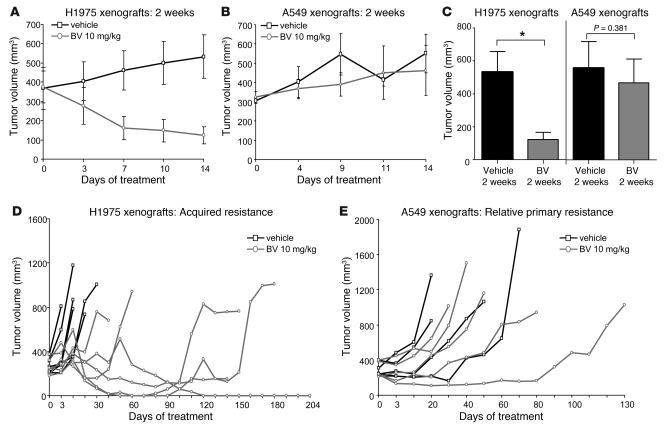
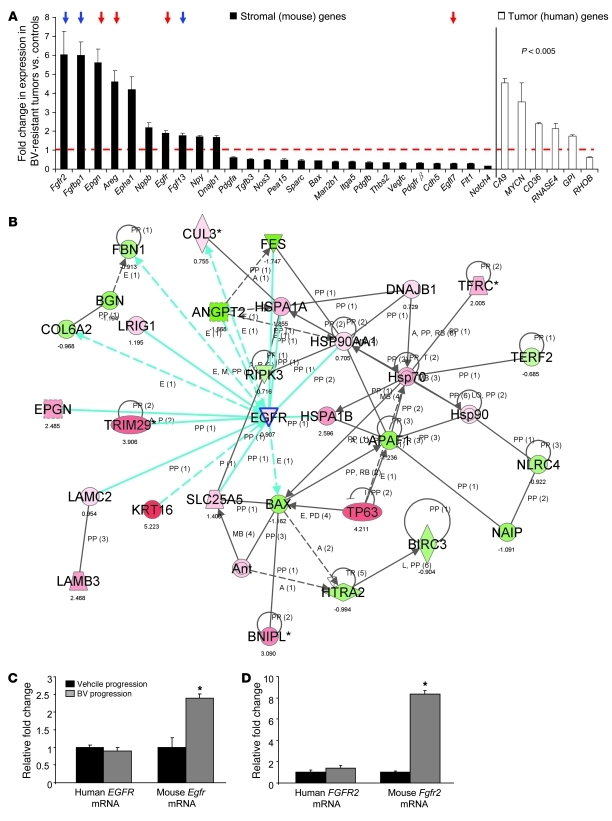
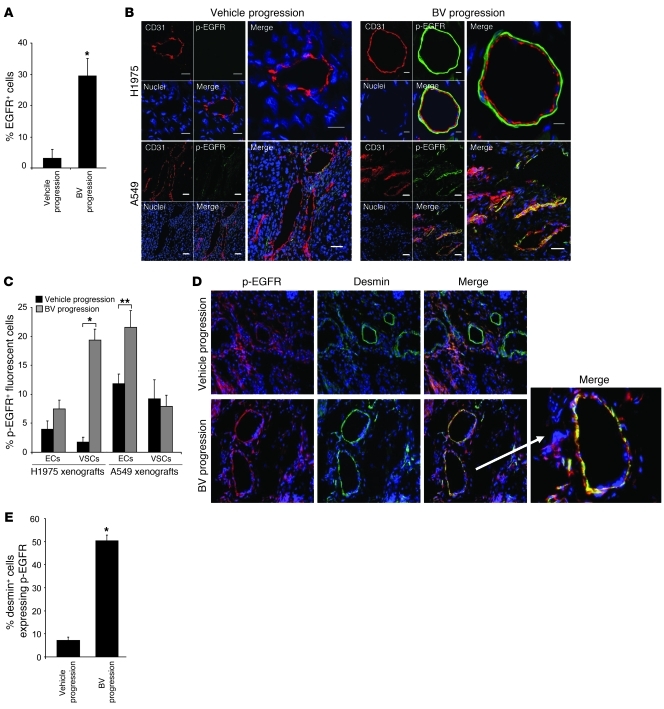
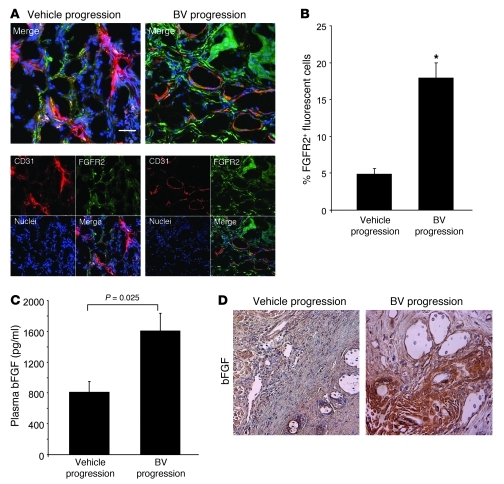
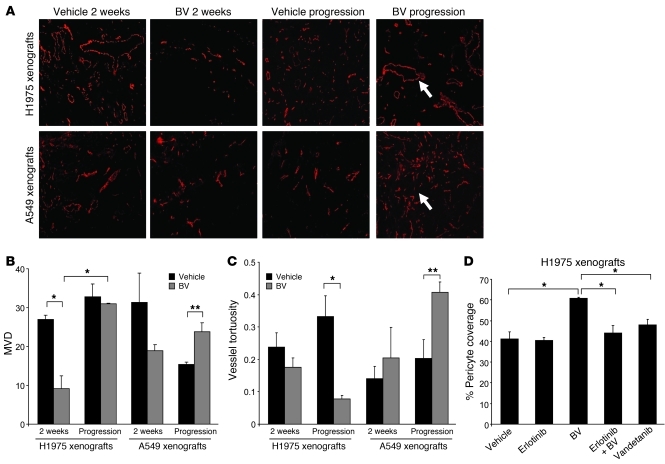
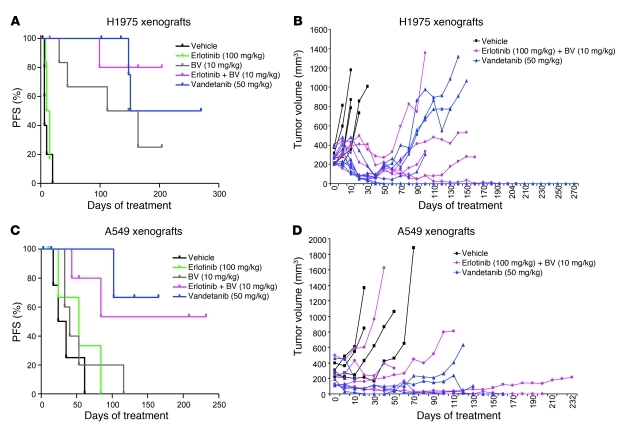
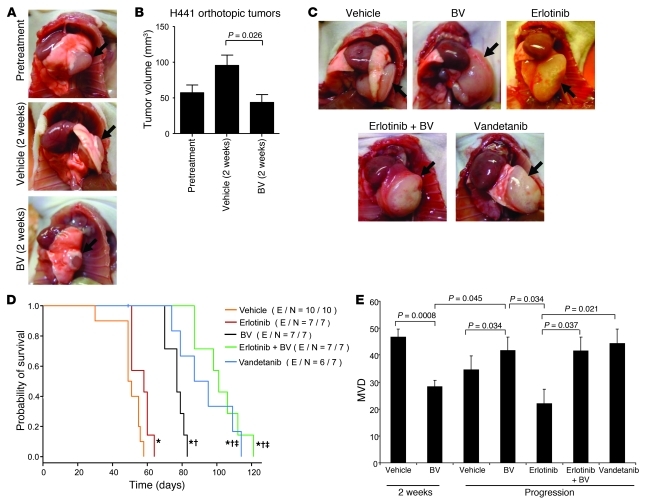
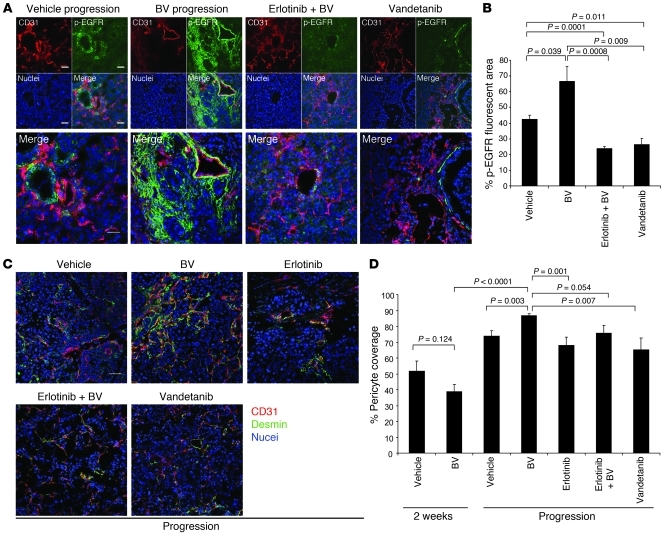
Angiogenesis is critical for tumor growth and metastasis, and several inhibitors of angiogenesis are currently in clinical use for the treatment of cancer. However, not all patients benefit from antiangiogenic therapy, and those tumors that initially respond to treatment ultimately become resistant. The mechanisms underlying this, and the relative contributions of tumor cells and stroma to resistance, are not completely understood. Here, using species-specific profiling of mouse xenograft models of human lung adenocarcinoma, we have shown that gene expression changes associated with acquired resistance to the VEGF inhibitor bevacizumab occurred predominantly in stromal and not tumor cells. In particular, components of the EGFR and FGFR pathways were upregulated in stroma, but not in tumor cells. Increased activated EGFR was detected on pericytes of xenografts that acquired resistance and on endothelium of tumors with relative primary resistance. Acquired resistance was associated with a pattern of pericyte-covered, normalized revascularization, whereas tortuous, uncovered vessels were observed in relative primary resistance. Importantly, dual targeting of the VEGF and EGFR pathways reduced pericyte coverage and increased progression-free survival. These findings demonstrated that alterations in tumor stromal pathways, including the EGFR and FGFR pathways, are associated with, and may contribute to, resistance to VEGF inhibitors and that targeting these pathways may improve therapeutic efficacy. Understanding stromal signaling may be critical for developing biomarkers for angiogenesis inhibitors and improving combination regimens.


Figures

Figure 1
Figure 1. H1975 and A549 NSCLC xenografts show different patterns of resistance to BV treatment.
(A and B) Tumor growth curves of H1975 (A; n = 5 per group) and A549 (B; n = 6 per group) xenografts receiving vehicle (control) and BV for 2 weeks. (C) Mean tumor volume obtained at the last measurement in H1975 and A549 xenografts treated with BV for 2 weeks compared with controls (ΔT/ΔC). *P < 0.05, Mann-Whitney test. (D and E) Individual tumor growth curves of H1975 (D; n = 6 per group) and A549 (E; n = 5 per group) xenografts treated with vehicle and BV until animals became moribund. Tumors were considered resistant (progression) when tripled in volume compared with the beginning of the treatment.
Figure 2
Figure 2. BV resistance is associated with increased expression of stromal genes involved in angiogenesis.
(A) Stromal and human angiogenic genes were differentially regulated in H1975 BV-resistant xenografts compared with vehicle controls (n = 3 per group). P < 0.005, 2-sample t test with random variance model. Exact permutation P values for significant genes were computed based on 10 available permutations. Data represent differences in fold change of genes in BV-resistant tumors versus controls. The dashed red line indicates fold change 1 (i.e., no change versus controls). Red and blue arrows indicate Egfr and Fgfr family member genes, respectively. (B) Functional pathway analysis of selected genes and their interaction nodes in a gene network significantly modulated between the BV-resistant and control xenograft mouse stroma. Network score was calculated by the inverse log of the P value and indicates the likelihood of focus genes in a network being found together not by chance. The selected genes (Egfr, Bax, and Dnajb1) and their interaction segments are highlighted by a blue border. Gene expression variation by at least 1.5-fold is indicated by color (red, upregulated; green, downregulated; gray, NS). (C and D) qRT-PCR showing human EGFR and mouse Egfr (C) and human FGFR2 and mouse Fgfr2 (D) mRNA expression in H1975 xenografts that progressed on vehicle and BV treatments (n = 4 per group). Data are normalized relative to vehicle progression samples and shown as relative fold change. *P < 0.05, t test.
Figure 3
Figure 3. BV resistance is associated with increased EGFR activation on VSCs and the tumor vasculature.
(A) Quantification of EGFR+ cells in H1975 xenografts that progressed on vehicle and BV, using LSC. *P < 0.01, t test. (B) Representative IF staining of CD31 (red), p-EGFR (green), and nuclei (blue) using confocal microscopy in vehicle- and BV-treated H1975 and A549 xenografts at progression. At least 5 microphotographs were collected per sample. Original magnification, ×200. Scale bars: 5 μm (H1975 BV); 10 μm (H1975 vehicle); 20 μm (A549). (C) Percent VSCs and ECs (CD31+) expressing p-EGFR in H1975 and A549 vehicle- and BV-treated tumors at progression. p-EGFR+ cells were counted in at least 5 random microscopic fields for each of 4 samples per group (×200). *P < 0.01, **P < 0.05, t test. (D) Representative IF images of p-EGFR, desmin, and nuclei staining in H1975 vehicle- and BV-treated xenografts at progression. At least 5 microphotographs were collected per specimen. White arrow denotes overlapping p-EGFR, desmin, and nuclei staining in BV-resistant H1975 tumors at higher magnification. Original magnification, ×200; ×400 (magnified merge image). (E) Percent desmin+ cells expressing p-EGFR in vehicle- and BV-treated H1975 tumors at progression. At least 5 random microscopic fields (×200) for each sample were analyzed. *P < 0.01, t test. (AE) n = 4 per group.
Figure 4
Figure 4. Increase in stromal FGFR2 expression in H1975 BV-resistant xenografts.
(A) Representative IF images of CD31 and FGFR2 staining in H1975 vehicle- and BV-treated H1975 xenografts at progression, using confocal microscopy. At least 5 microphotographs were collected from 4 specimens per group. Original magnification, ×200. Scale bar: 20 μm. (B) Percent FGFR2+ fluorescent cells counted in 5 random microscopic fields (×200) per sample (n = 4 per group). *P < 0.001, t test. (C) bFGF levels were measured in plasma of vehicle- and BV-treated H1975 xenografts at progression, using multiplex bead assay (n = 4 per group; each sample tested in duplicate). P value was calculated using t test. (D) Representative IHC images showing bFGF protein expression in vehicle- and BV-treated H1975 xenografts. At least 5 random microscopic fields were collected from each of 4 specimens per group. Original magnification, ×200.
Figure 5
Figure 5. Altered patterns of tumor vascular density, tortuosity, and pericyte coverage in BV-resistant xenograft tumors.
(A) Microphotographs of CD31+ tumor vessels (red) in H1975 and A549 xenografts treated with vehicle and BV after 2 weeks and at progression. 5–10 microscopic fields were collected from each of 4 specimens per group. Arrows indicate the different vessel morphology in H1975 (top panel) and A549 (lower panel) BV-resistant tumors. Original magnification, ×100. (B and C) Quantification of MVD (B) and vessel tortuosity (C) based on CD31-stained tumor sections in H1975 and A549 xenografts treated with vehicle and BV after 2 weeks and at progression. 5 hotspot microscopic fields (×200) per tumor section were analyzed to quantify MVD; 5 random microscopic fields (×100) were quantified for vessel tortuosity analysis. n = 4 per group. Units of the y axis for MVD (B) represent CD31 + vessels per HPF (high power field). The y axis for vessel tortuosity (C) represents the ratio T = (L/S) – 1. (D) Pericyte coverage of H1975 xenografts was quantified as percent CD31+ vessels with at least 50% coverage of associated desmin+ cells in at least 5 microscopic fields (×200) in tumors receiving long-term treatment. n = 2 (vandetanib); 3 (erlotinib); 4 (vehicle, BV, and erlotinib+BV). (BD) *P < 0.01, **P < 0.05, t test.
Figure 6
Figure 6. Effect of dual EGFR/VEGFR2 inhibition on H1975 and A549 NSCLC xenograft models.
(A and C) Distribution of PFS, shown by Kaplan-Meier plots, and (B and D) individual tumor growth curves of H1975 (A and B) and A549 (C and D) xenografts receiving long-term treatment as indicated. Log-rank test was used to compare statistical differences in survival among treatment groups.
Figure 7
Figure 7. Orthotopic H441 NSCLC tumor growth and MVD after VEGF blockade or dual EGFR/VEGFR pathway inhibition.
(A and B) Representative photographs (A) and mean tumor volume obtained at the last measurement (B) of H441 orthotopic tumors before or after 2 weeks of treatment. Arrows denote tumor mass in the lung. n = 8 (pretreatment); 9 (vehicle); 10 (BV). P value was calculated using Mann-Whitney test. (C) Representative photographs of H441 orthotopic tumors after long-term administration. n = 10 (vehicle); 7 (erlotinib, BV, and erlotinib+BV); 6 (vandetanib). Arrows denote tumor mass in the lung. (D) Kaplan-Meier plots showing survival distribution in H441 orthotopic tumor–bearing mice treated as indicated. Number of events (E) per number in each group (N) is indicated. *P < 0.05 versus vehicle, P < 0.01 versus erlotinib, P < 0.05 versus BV, log-rank test. (E) MVD quantification in H441 orthotopic tumors. n = 4 (erlotinib); 5 (vehicle 2 weeks and vandetanib); 6 (BV 2 weeks and vehicle progression); 7 (BV progression and erlotinib+BV). Statistical values were calculated using t test. Units in the y axis for MVD represent CD31 + vessels per HPF.
Figure 8
Figure 8. EGFR is activated in H441 BV-resistant tumors, and dual EGFR/VEGFR inhibition reduces pericyte coverage.
(A) Representative microphotographs of CD31 (red), p-EGFR (green), and nuclei (blue) fluorescent staining in H441 tumors that progressed on vehicle, BV, erlotinib+BV, and vandetanib treatments, using confocal microscopy. At least 5 microphotographs were collected from all the tumor specimens in each group. Original magnification, ×200. Scale bar: 50 μm. (B) Percent p-EGFR fluorescent area in H441 tumors that progressed while on the indicated therapies, as determined using Alpha Innotech Software. 5–10 random microphotographs (×200) of red (CD31), green (p-EGFR), and blue (nuclei) fluorescence were collected from 5 (vehicle and BV), 6 (erlotinib+BV), and 4 (vandetanib) specimens per group. P values were calculated using t test. (C) Representative IF images of CD31, desmin, and nuclei in H441 tumors that progressed while on the indicated treatments, using confocal microscopy. At least 5 microphotographs were collected from all the tumor specimens per group. Original magnification, ×200. Scale bar: 50 μm. (D) Percent pericyte coverage in H441 tumors was quantified in at least 5 microscopic fields (×200) of tumor specimens. n = 4 (erlotinib); 5 (vehicle 2 weeks and vandetanib); 6 (BV 2 weeks and vehicle progression); 7 (BV progression and erlotinib+BV). P values were calculated using t test.

Comment in

Similar articles

Cited by

References

    1. Folkman J, Shing Y. Angiogenesis. J Biol Chem. 1992;267(16):10931–10934. - PubMed
    1. Folkman J. Tumor angiogenesis: therapeutic implications. N Engl J Med. 1971;285(21):1182–1186. doi: 10.1056/NEJM197111182852108. - DOI - PubMed
    1. Carmeliet P, Jain RK. Angiogenesis in cancer and other diseases. Nature. 2000;407(6801):249–257. doi: 10.1038/35025220. - DOI - PubMed
    1. Ferrara N, Gerber HP, LeCouter J. The biology of VEGF and its receptors. Nat Med. 2003;9(6):669–676. doi: 10.1038/nm0603-669. - DOI - PubMed
    1. Ferrara N, Davis-Smyth T. The biology of vascular endothelial growth factor. Endocr Rev. 1997;18(1):4–25. - PubMed

Publication types

MeSH terms

Associated data