

Pathogens, social networks, and the paradox of transmission scaling
- PMID: 21436998
- PMCID: PMC3062980
- DOI: 10.1155/2011/267049
Pathogens, social networks, and the paradox of transmission scaling
Abstract
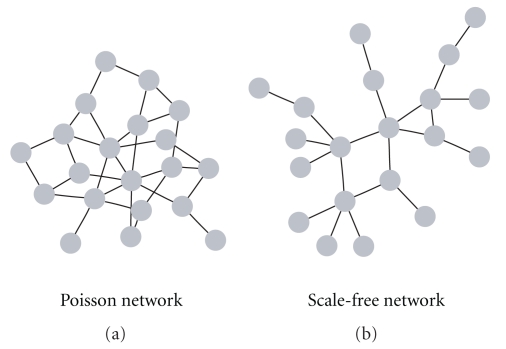
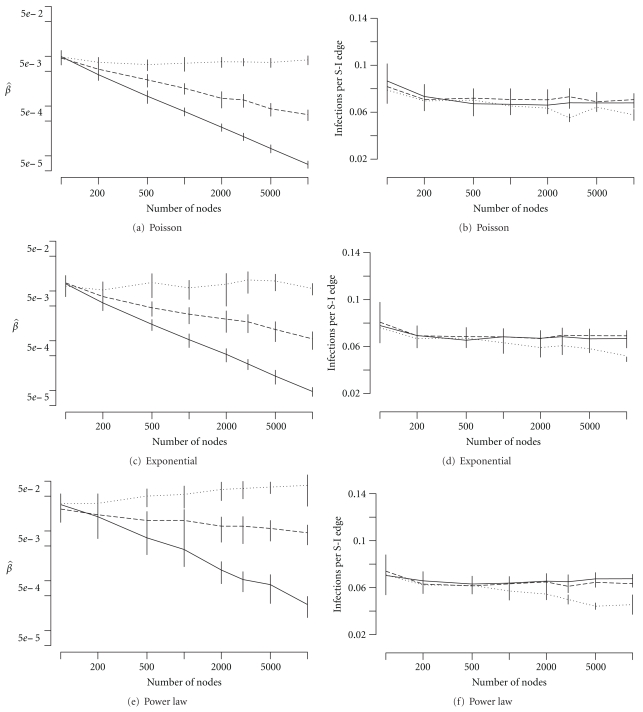
Understanding the scaling of transmission is critical to predicting how infectious diseases will affect populations of different sizes and densities. The two classic "mean-field" epidemic models-either assuming density-dependent or frequency-dependent transmission-make predictions that are discordant with patterns seen in either within-population dynamics or across-population comparisons. In this paper, we propose that the source of this inconsistency lies in the greatly simplifying "mean-field" assumption of transmission within a fully-mixed population. Mixing in real populations is more accurately represented by a network of contacts, with interactions and infectious contacts confined to the local social neighborhood. We use network models to show that density-dependent transmission on heterogeneous networks often leads to apparent frequency dependency in the scaling of transmission across populations of different sizes. Network-methodology allows us to reconcile seemingly conflicting patterns of within- and across-population epidemiology.
Figures

References
-
- Altizer S, Nunn CL, Thrall PH, et al. Social organization and parasite risk in mammals: integrating theory and empirical studies. Annual Review of Ecology, Evolution, and Systematics. 2003;34:517–547.
-
- Newman MEJ. Spread of epidemic disease on networks. Physical Review E. 2002;66(1):11 pages. Article ID 016128. - PubMed
-
- Pastor-Satorras R, Vespignani A. Epidemic spreading in scale-free networks. Physical Review Letters. 2001;86(14):3200–3203. - PubMed
LinkOut - more resources
Full Text Sources
