. 2010 Dec;6(4):429-45.
doi: 10.1007/s11302-010-9207-6. Epub 2010 Dec 1.

Purinergic receptor-mediated Ca signaling in the olfactory bulb and the neurogenic area of the lateral ventricles

Purinergic receptor-mediated Ca signaling in the olfactory bulb and the neurogenic area of the lateral ventricles

Thomas Hassenklöver et al. Purinergic Signal. 2010 Dec.

Abstract

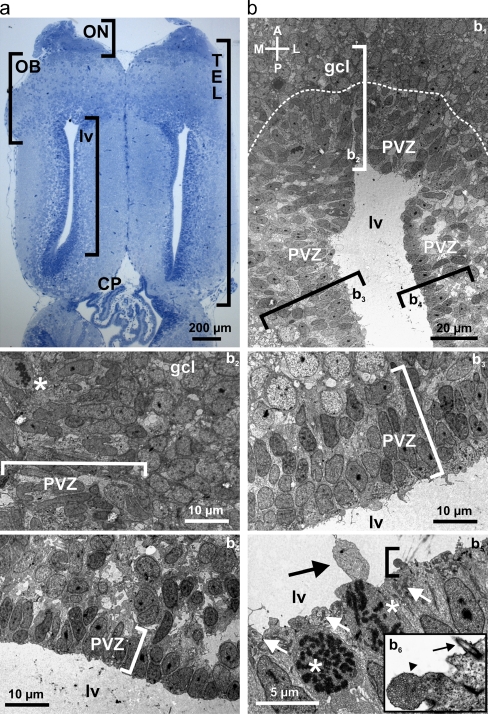
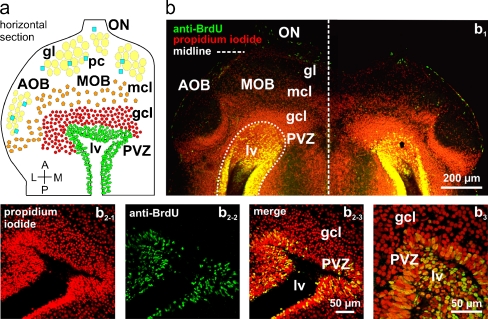
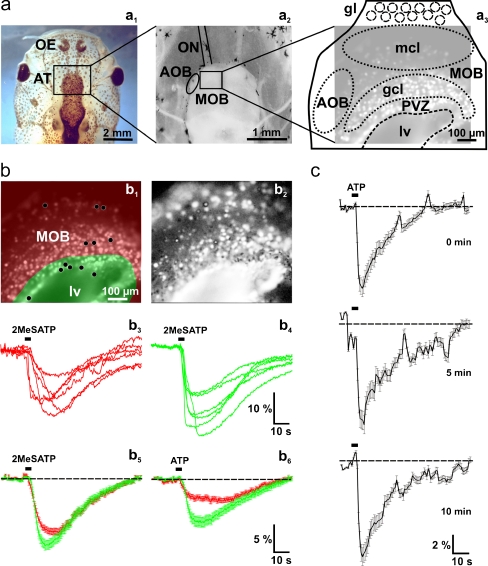
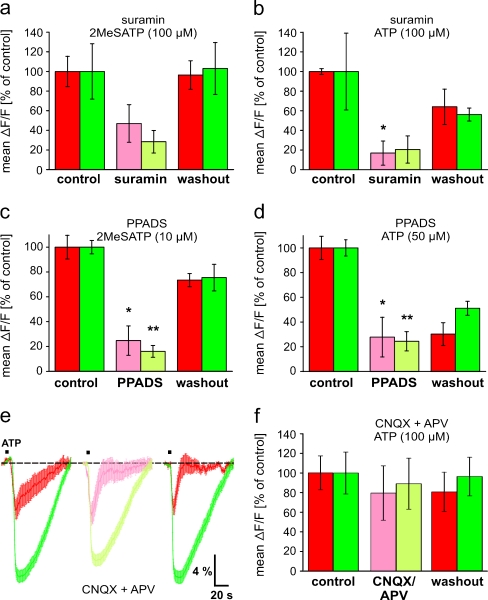
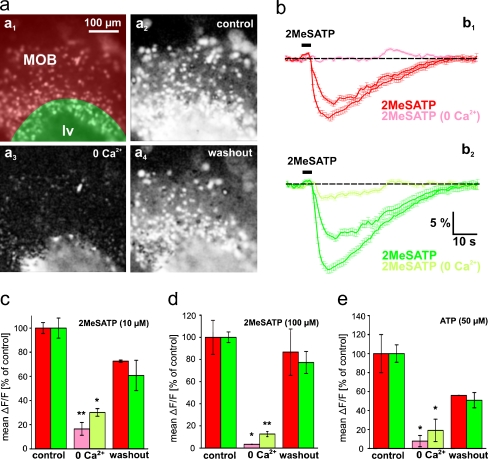
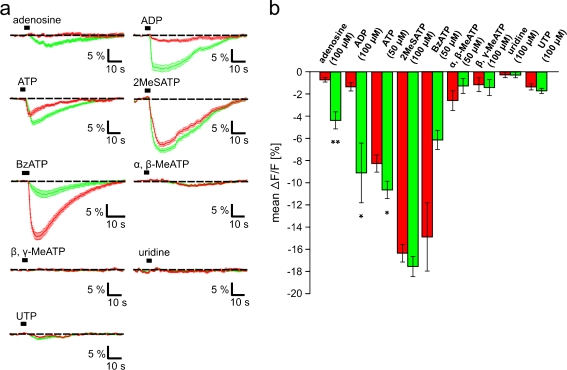
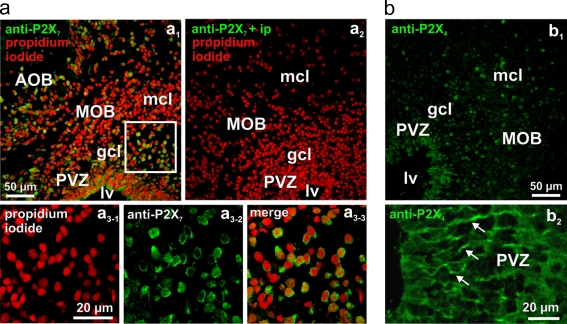
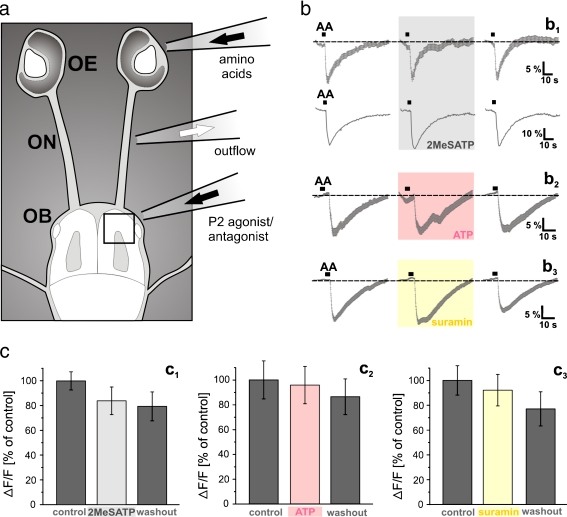
Like in other vertebrates, the anterior part of the telencephalon of amphibians mainly consists of the olfactory bulb (OB), but different from higher vertebrates, the lateral telencephalic ventricles of larval Xenopus laevis expand deep into the anterior telencephalon. The neurogenic periventricular zone (PVZ) of the lateral ventricles generates new OB neurons throughout the animal's lifetime. We investigated the ultrastructural organization of the PVZ and found that within a time period of 24 h, 42.54 ± 6.65% of all PVZ cells were actively proliferating. Functional purinergic receptors are widespread in the central nervous system and their activation has been associated with many critical physiological processes, including the regulation of cell proliferation. In the present study we identified and characterized the purinergic system of the OB and the PVZ. ATP and 2MeSATP induced strong [Ca(2+)](i) increases in cells of both regions, which could be attenuated by purinergic antagonists. However, a more thorough pharmacological investigation revealed clear differences between the two brain regions. Cells of the OB almost exclusively express ionotropic P2X purinergic receptor subtypes, whereas PVZ cells express both ionotropic P2X and metabotropic P1 and P2Y receptor subtypes. The P2X receptors expressed in the OB are evidently not involved in the immediate processing of olfactory information.

Keywords: Neuronal stem cells; Olfaction; P1 receptors; P2 receptors; Subventricular zone.


Figures

Fig. 1
Fig. 1
Ultrastructural analysis of the anterior telencephalon. a Horizontal slice of the telencephalon of larval X. laevis stained with Methylenblue-Azur II. b Transmission electron microscopy of the anterior part of the lateral telencephalic ventricles with its PVZ and the posterior part of the granule cell layer of the OB (b 1). Various electron micrographs were assembled into a photo montage to obtain this overview. The dotted line indicates the approximate border between the PVZ and the granule cell layer of the OB. The brackets indicate the approximate location of the areas shown at higher magnification in b2 through b4. Anterior part of the PVZ and adjacent granule cell layer of the OB (b 2). Cell divisions are frequent in the PVZ. Note the cell with decomposed nuclear envelope and condensed DNA in form of chromosomes (asterisk). Medial part of the PVZ (b 3) and lateral part of the PVZ (b 4). The brackets in b 2 through b 4 include the cell layers of the anterior, medial, and lateral PVZ, respectively. b5 shows a higher magnification of cells in direct contact with the lumen of the lateral ventricles. Two cells are in mitosis (asterisks). The white arrows indicate accumulations of mitochondria very close to the ventricular lumen. The black arrow shows a large cellular protrusion into the ventricle. The area included in the bracket is shown at higher magnification in b6. Note the multivesicular protrusion into the ventricle (arrowhead) and the single cilium extending into the cerebrospinal fluid (arrow). Abbreviations: ON olfactory nerve, OB olfactory bulb, PVZ periventricular zone, TEL telencephalon, CP choroid plexus, lv lateral ventricle, gcl granule cell layer
Fig. 2
Fig. 2
Cells in the periventricular zone of the lateral ventricle actively proliferate. a Schematic representation of the anterior telencephalon of larval X. laevis. b Overview over a horizontal section of the anterior telencephalon (b 1) in which all cell nuclei were stained with propidium iodide (red fluorescence) and proliferating cells were visualized with a BrdU incorporation assay (green fluorescence). Proliferating cells appear yellow. Higher magnification of the periventricular region of different animals (b 2-1b 2-3 and b 3). Abbreviations: ON olfactory nerve, MOB main olfactory bulb, AOB accessory olfactory bulb, PVZ periventricular zone, gl glomerular layer/glomeruli, mcl mitral cell layer, gcl granule cell layer, lv lateral ventricle, pc periglomerular cells
Fig. 3
Fig. 3
Nucleotide-induced [Ca2+]i increases in cells of the anterior telencephalon. a Overview of a head of larval X. laevis (a 1). The black rectangle indicates the location of the anterior telencephalon. An acute slice preparation of the telencephalon is shown in a 2. The black rectangle indicates the approximate location of the Fura-2/AM stained slice shown in a3 (brightened fluorescence image acquired at rest). b Fura-2/AM stained slice preparation (the same as shown in a3) with the area of the OB shaded in red, and the PVZ shaded in green (b 1). Pixel correlation map of the same slice (see “Materials and methods” section for details) obtained upon application of 2MeSATP (5 μM; b2). The ventricle appears to respond as a whole. This results from responses of ependymal cells from the floor of the lateral ventricle. The 2MeSATP-induced [Ca2+]i transients of six individual cells of the OB (see black dots in the red-shaded area in b1) and the PVZ (see black dots in the green shaded area in b1) are shown in b3 and b4, respectively. The 2MeSATP-induced mean [Ca2+]i transients (±SEM) of all clearly identifiable responsive cells of the OB (red traces; n = 138) and the cells of the PVZ (green traces; n = 32) of this slice are shown in b5. Application of ATP (50 μM) to the same slice preparation induced comparable [Ca2+]i transients in the same cells as above (b 6). (c) Mean [Ca2+]i transients of responding OB and PVZ cells (n = 120) remain stable after repeated applications of ATP (100 μM; interstimulus interval: 5 min). Abbreviations: OE olfactory epithelium, AT anterior telencephalon, ON olfactory nerve, MOB main olfactory bulb, AOB accessory olfactory bulb, PVZ periventricular zone, gl glomerular layer/glomeruli, mcl mitral cell layer, gcl granule cell layer, lv lateral ventricle
Fig. 4
Fig. 4
Effects of purinergic and glutamatergic antagonists on nucleotide-induced [Ca2+]i increases in cells of the anterior telencephalon. a Mean peak responses (±SEM), expressed as percent of control response to 2MeSATP (100 μM), of 186 OB cells and 80 PVZ cells (three slices of the anterior telencephalon) in control conditions (red and green columns on the left-hand side, respectively), after 10 min in bath solution with 200 μM suramin (light red and light green column, respectively), and after 10 min of washout with bath solution (red and green columns on the right-hand side, respectively). b Same representation as in a with ATP (100 μM) and suramin [200 μM; 90 OB cells and 72 PVZ cells (two and three slices of the anterior telencephalon, respectively)]. c Same representation as in a with 2MeSATP (10 μM) and PPADS [200 μM; 155 OB cells and 216 PVZ cells (two slices of the anterior telencephalon)]. d Same representation as in a with ATP (50 μM) and PPADS [200 μM; 242 OB cells and 262 PVZ cells (three slices of the anterior telencephalon)]. e The peak amplitudes of ATP-induced (100 μM) mean [Ca2+]i transients (±SEM) of all responsive cells (OB: n = 21, red traces; PVZ: n = 47, green traces) of an individual slice of the anterior telencephalon are not significantly attenuated by 50 μM CNQX and 200 μM APV (OB: light red trace; PVZ: light green trace). f Mean peak responses (±SEM), expressed as percent of control response to ATP (100 μM), of 287 OB cells and 360 PVZ cells (seven slices of the anterior telencephalon) in control conditions (red and green columns on the left-hand side, respectively), after 5 min in bath solution with 50 μM CNQX and 200 μM APV (light red and light green column, respectively), and after 10 min of washout with bath solution (red and green columns on the right-hand side, respectively). (*p < 0.05 and **p < 0.01; unpaired t test)
Fig. 5
Fig. 5
Nucleotide-induced responses of OB and PVZ cells are differentially affected by omission of extracellular Ca2+. a Fura-2/AM stained acute slice preparation of the anterior telencephalon (a 1; image acquired at rest). The area of the OB is shaded in red, and the area of the PVZ is shaded in green. Pixel correlation maps of the same slice (see “Materials and methods” section for details) obtained upon application of 2MeSATP (100 μM; a 2 standard bath solution; a 3 application after 10 min in Ca2+-free bath solution; a 4 application after returning to standard bath solution). b The corresponding 2MeSATP-induced mean [Ca2+]i transients (±SEM) of all clearly identifiable responsive cells of the OB [b 1 red traces: in normal bath solution (before and after application of Ca2+-free bath solution); light red traces: after 10 min in Ca2+-free bath solution; n = 82 cells] and of the PVZ [b 2 green traces: in normal bath solution (before and after application of Ca2+-free bath solution); light green traces: after 10 min in Ca2+-free bath solution; n = 59 cells]. c Mean peak responses (±SEM), expressed as percent of control response to 2MeSATP (10 μM), of 161 OB cells and 182 PVZ cells (two slices of the anterior telencephalon) in control conditions (red and green columns, respectively) and after 10 min in Ca2+-free bath solution (light red and light green column, respectively). d Same representation as in C with 2MeSATP [100 μM; 205 OB cells and 105 PVZ cells (two slices of the anterior telencephalon)]. e Same representation as in C with ATP [50 μM; 161 OB cells and 182 PVZ cells (two slices of the anterior telencephalon)]. (*p < 0.05 and **p < 0.01; unpaired t test). Abbreviations: MOB main olfactory bulb, lv lateral ventricle
Fig. 6
Fig. 6
Responsiveness of OB and PVZ cells to purinergic receptor agonists. a Mean [Ca2+]i transients (±SEM) of all clearly identifiable responsive cells of an OB (red traces) and a PVZ (green traces). Traces originate from more than one tissue slice. b The mean peak amplitude of agonist-induced responses (±SEM) of cells of the OB and the PVZ were compared (red columns OB cells, green columns PVZ cells). [adenosine (100 μM), data from 170 OB cells and 236 PVZ cells from 6 slices of the anterior telencephalon; ADP (100 μM), 245 OB cells and 154 PVZ cells from three slices; ATP (50 μM), 1566 OB cells and 1303 PVZ cells from 28 and 23 slices, respectively; 2MeSATP (100 μM), 378 OB cells and 285 PVZ cells from five slices; BzATP (50 μM), 213 OB cells and 93 PVZ cells from four and two slices, respectively; α,β-MeATP (50 μM), 310 OB cells and 198 PVZ cells from six and three slices, respectively; β,γ-MeATP (100 μM), 387 OB cells and 318 PVZ cells from seven and six slices, respectively; uridine (100 μM), 275 OB cells and 308 PVZ cells from six slices; UTP (100 μM), 335 OB cells and 324 PVZ cells from five slices]. (*p < 0.05 and **p < 0.01; unpaired t test). Abbreviations: ADP adenosine-5′-diphosphate, ATP adenosine-5′-triphosphate, UTP uridine-5′-triphosphate; α,β-MeATP α,β-methylene-ATP, β,γ-MeATP β,γ-methylene-ATP, 2MeSATP 2-methylthio-ATP, BzATP, 3′-O-(4-benzoyl)benzoyl ATP
Fig. 7
Fig. 7
Distribution of P2X7- and P2X4-like immunoreactivity in the anterior telencephalon. a Immunoreactivity to a P2X7 antibody (green fluorescence) and cell nuclei staining with propidium iodide (red fluorescence) of a slice of the anterior telencephalon is shown in a1. Another slice treated with the anti-P2X7 antibody after preadsorption with the immunizing protein and counterstained with propidium iodide is shown in a2. Higher magnification of the region indicated by the white rectangle in a1 is shown in a3-1–a3-3. Note the clear somatic staining pattern of OB cells. b Immunoreactivity to a P2X4 antibody (b 1) of another slice of the anterior telencephalon. Higher magnification of the P2X4-like immunoreactivity of the PVZ (b 2). Note the stained tubular structures starting from the lateral ventricle and extending towards the OB (see arrows). Abbreviations: MOB main olfactory bulb, AOB accessory olfactory bulb, PVZ periventricular zone, lv lateral ventricle, mcl mitral cell layer, gcl granule cell layer
Fig. 8
Fig. 8
Impact of the telencephalic purinergic system on the immediate processing of olfactory information in OB cells. a Schematic representation of a nose–brain preparation of larval X. laevis. The black rectangle indicates the area of the telencephalon monitored in the Ca2+ imaging experiments. b The mean response (±SEM) of all responsive cells of an OB (n = 45 cells) upon epithelial application of an odorant mixture (15 amino acids, each at 100 μM; see “Materials and methods” section) was not affected by continuous OB stimulation with 5 μM 2MeSATP (b1, upper row). Compare the trace in the gray-shaded area (amino acid-induced responses after 10 min of 2MeSATP perfusion) with the traces to its left (amino acid-induced responses prior to 2MeSATP perfusion) and right (amino acid-induced responses after 5 min washout of 2MeSATP). The lower row of b1 shows the amino acid-induced [Ca2+]i transient of a randomly chosen individual cell of the same slice. Also, the mean response (± SEM) of all amino acid-responsive cells of an OB (n = 23 cells) was not affected by continuous OB stimulation with 100 μM ATP (b 2). Compare the trace in the light red-shaded area (amino acid-induced responses after 10 min of ATP perfusion) with the traces to its left (amino acid-induced responses prior to ATP perfusion) and right (amino acid-induced responses after 5 min washout of ATP). Prolonged application of 200 μM suramin did also not disrupt the mean response (±SEM) of all amino acid-responsive cells of an OB (n = 35 cells; b 3). Compare the trace in the yellow-shaded area (amino acid-induced responses after 5 min of suramin perfusion) with the traces to its left (amino acid-induced responses prior to suramin perfusion) and right (amino acid-induced responses after 5 min washout of suramin). c The mean peak responses (±SEM), expressed as percent of control response to an epithelial application of 100 μM amino acid mixture (200 OB cells from four nose–brain preparations) in control conditions (dark gray columns) and after 5 to 10 min in bath solution with 5–20 μM 2MeSATP (light gray column) are shown in c1. The mean peak responses ± SEM, expressed as percent of control response to an epithelial application of 100 μM amino acid mixture [78 OB cells/5 slices for ATP (100 μM) and 81 OB cells/4 slices for suramin 200 μM)] in control conditions (dark gray columns) and after 5 to 10 min in bath solution with ATP or suramin (light red and yellow column) are respectively given in c2 and c3. Abbreviations: OE olfactory epithelium, ON olfactory nerve, OB olfactory bulb, AA amino acid mixture

Similar articles

Cited by

References

    1. Lledo PM, Gheusi G, Vincent JD. Information processing in the mammalian olfactory system. Physiol Rev. 2005;85:281–317. doi: 10.1152/physrev.00008.2004. - DOI - PubMed
    1. Hildebrand JG, Shepherd GM. Mechanisms of olfactory discrimination: converging evidence for common principles across phyla. Annu Rev Neurosci. 1997;20:595–631. doi: 10.1146/annurev.neuro.20.1.595. - DOI - PubMed
    1. Endo T, Yoshino J, Kado K, Tochinai S. Brain regeneration in anuran amphibians. Dev Growth Differ. 2007;49:121–129. doi: 10.1111/j.1440-169X.2007.00914.x. - DOI - PubMed
    1. Filoni S, Bernardini S, Cannata SM. Differences in the decrease in regenerative capacity of various brain regions of Xenopus laevis are related to differences in the undifferentiated cell populations. J Hirnforsch. 1995;36:523–529. - PubMed
    1. Chojnacki AK, Mak GK, Weiss S. Identity crisis for adult periventricular neural stem cells: subventricular zone astrocytes, ependymal cells or both? Nat Rev Neurosci. 2009;10:153–163. doi: 10.1038/nrn2571. - DOI - PubMed

LinkOut - more resources