

Screening of random peptide library of hemagglutinin from pandemic 2009 A(H1N1) influenza virus reveals unexpected antigenically important regions
- PMID: 21437206
- PMCID: PMC3060926
- DOI: 10.1371/journal.pone.0018016
Screening of random peptide library of hemagglutinin from pandemic 2009 A(H1N1) influenza virus reveals unexpected antigenically important regions
Abstract
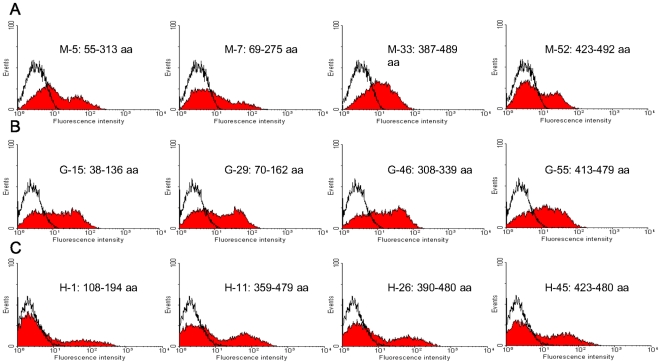
The antigenic structure of the membrane protein hemagglutinin (HA) from the 2009 A(H1N1) influenza virus was dissected with a high-throughput screening method using complex antisera. The approach involves generating yeast cell libraries displaying a pool of random peptides of controllable lengths on the cell surface, followed by one round of fluorescence-activated cell sorting (FACS) against antisera from mouse, goat and human, respectively. The amino acid residue frequency appearing in the antigenic peptides at both the primary sequence and structural level was determined and used to identify "hot spots" or antigenically important regions. Unexpectedly, different antigenic structures were seen for different antisera. Moreover, five antigenic regions were identified, of which all but one are located in the conserved HA stem region that is responsible for membrane fusion. Our findings are corroborated by several recent studies on cross-neutralizing H1 subtype antibodies that recognize the HA stem region. The antigenic peptides identified may provide clues for creating peptide vaccines with better accessibility to memory B cells and better induction of cross-neutralizing antibodies than the whole HA protein. The scheme used in this study enables a direct mapping of the antigenic regions of viral proteins recognized by antisera, and may be useful for dissecting the antigenic structures of other viral proteins.
Conflict of interest statement
Figures


Similar articles
-
Minor changes in the hemagglutinin of influenza A(H1N1)2009 virus alter its antigenic properties.PLoS One. 2011;6(10):e25848. doi: 10.1371/journal.pone.0025848. Epub 2011 Oct 11. PLoS One. 2011. PMID: 22022458 Free PMC article.
-
Mini-HA Is Superior to Full Length Hemagglutinin Immunization in Inducing Stem-Specific Antibodies and Protection Against Group 1 Influenza Virus Challenges in Mice.Front Immunol. 2018 Oct 12;9:2350. doi: 10.3389/fimmu.2018.02350. eCollection 2018. Front Immunol. 2018. PMID: 30369928 Free PMC article.
-
Diverse antigenic site targeting of influenza hemagglutinin in the murine antibody recall response to A(H1N1)pdm09 virus.Virology. 2015 Nov;485:252-62. doi: 10.1016/j.virol.2015.08.004. Epub 2015 Aug 27. Virology. 2015. PMID: 26318247 Free PMC article.
-
Novel universal influenza virus vaccine approaches.Curr Opin Virol. 2016 Apr;17:95-103. doi: 10.1016/j.coviro.2016.02.002. Epub 2016 Feb 27. Curr Opin Virol. 2016. PMID: 26927813 Free PMC article. Review.
-
Influenza Hemagglutinin Structures and Antibody Recognition.Cold Spring Harb Perspect Med. 2020 Aug 3;10(8):a038778. doi: 10.1101/cshperspect.a038778. Cold Spring Harb Perspect Med. 2020. PMID: 31871236 Free PMC article. Review.
Cited by
-
Localization Analysis of Heterophilic Antigen Epitopes of H1N1 Influenza Virus Hemagglutinin.Virol Sin. 2019 Jun;34(3):306-314. doi: 10.1007/s12250-019-00100-9. Epub 2019 Apr 24. Virol Sin. 2019. PMID: 31020574 Free PMC article.
-
Design and Manufacture of a Low-Cost Microfluidic System for the Synthesis of Giant Liposomes for the Encapsulation of Yeast Homologues: Applications in the Screening of Membrane-Active Peptide Libraries.Micromachines (Basel). 2021 Nov 10;12(11):1377. doi: 10.3390/mi12111377. Micromachines (Basel). 2021. PMID: 34832789 Free PMC article.
-
Epidemiology of the influenza A virus H5N1 subtype and memory of immunity to the H2N2 subtype.mBio. 2012 Jul 10;3(4):e00138-12. doi: 10.1128/mBio.00138-12. Print 2012. mBio. 2012. PMID: 22782524 Free PMC article. No abstract available.
-
Molecular epidemiology of influenza A virus infection among hospitalized children in Vietnam during post-pandemic period.J Med Virol. 2015 Jun;87(6):904-12. doi: 10.1002/jmv.24143. Epub 2015 Feb 3. J Med Virol. 2015. PMID: 25648607 Free PMC article.
-
Recombinant production of influenza hemagglutinin and HIV-1 GP120 antigenic peptides using a cleavable self-aggregating tag.Sci Rep. 2016 Nov 3;6:35430. doi: 10.1038/srep35430. Sci Rep. 2016. PMID: 27808126 Free PMC article.
References
-
- Skehel JJ, Wiley DC. Receptor binding and membrane fusion in virus entry: The influenza hemagglutinin. Annu Rev Biochem. 2000;69:531–569. - PubMed
Publication types
MeSH terms
Substances
LinkOut - more resources
Full Text Sources
Medical
