. 2011 Mar;7(3):e1001344.
doi: 10.1371/journal.pgen.1001344. Epub 2011 Mar 17.

Viral genome segmentation can result from a trade-off between genetic content and particle stability

Affiliations

Viral genome segmentation can result from a trade-off between genetic content and particle stability

Samuel Ojosnegros et al. PLoS Genet. 2011 Mar.

Abstract

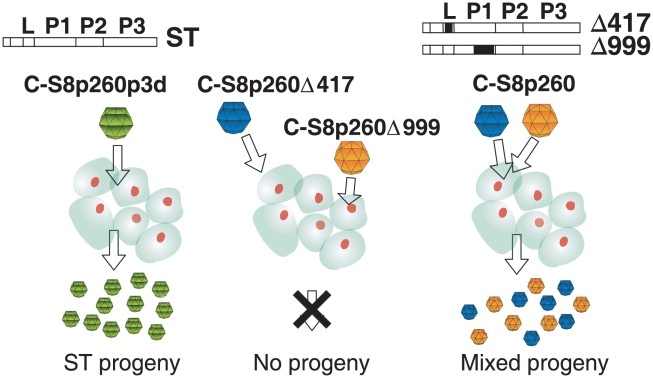
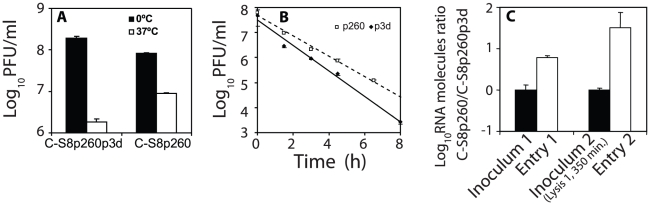
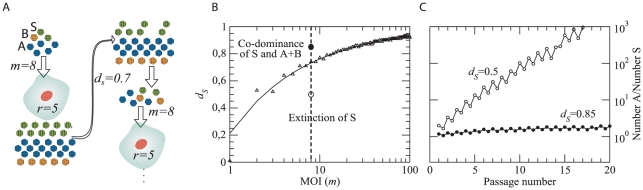
The evolutionary benefit of viral genome segmentation is a classical, yet unsolved question in evolutionary biology and RNA genetics. Theoretical studies anticipated that replication of shorter RNA segments could provide a replicative advantage over standard size genomes. However, this question has remained elusive to experimentalists because of the lack of a proper viral model system. Here we present a study with a stable segmented bipartite RNA virus and its ancestor non-segmented counterpart, in an identical genomic nucleotide sequence context. Results of RNA replication, protein expression, competition experiments, and inactivation of infectious particles point to a non-replicative trait, the particle stability, as the main driver of fitness gain of segmented genomes. Accordingly, measurements of the volume occupation of the genome inside viral capsids indicate that packaging shorter genomes involves a relaxation of the packaging density that is energetically favourable. The empirical observations are used to design a computational model that predicts the existence of a critical multiplicity of infection for domination of segmented over standard types. Our experiments suggest that viral segmented genomes may have arisen as a molecular solution for the trade-off between genome length and particle stability. Genome segmentation allows maximizing the genetic content without the detrimental effect in stability derived from incresing genome length.


Conflict of interest statement

The authors have declared that no competing interests exist.

Figures

Figure 1
Figure 1. Schematic representation of the segmented and ST virus.
The illustration shows the requirement of double infection for complementation and progeny production by the segmented FMDV population C-S8p260, but not by its ST derivative C-S8p260p3d , . A scheme of the FMDV genome with indication of the four main coding regions (L, P1, P2, P3) and the position of the internal deletions (Δ, black boxes) is drawn for each genotype.
Figure 2
Figure 2. Growth-competition between FMDV mutants.
At each time point (passage number), the ratio of RNA genomic molecules between the two competing viruses is represented. The data has been fitted to normalized exponential equations: (⧫), left panel, C-S8p260/C-S8p260p3d ratio 1∶1, y = 1.1·e0.92×, R2 = 0,92; right panel C-S8p260/C-S8p260p3d ratio 1∶1000, y = 0,73·e0.90×, R2 = 0,98; (▴), C-S8p260/C922L150: y = 16.5·e1.251×, R2 = 0,97; (▪), C-S8p260p3d/C922L150: y = 1,74·e0.701×, R2 = 0,84; (○), C-S8p260/C-S8p460p5d: y = 2.16·e0.78×, R2 = 0,87. The results of fitness determinations are given in Table 1.
Figure 3
Figure 3. Replication kinetics of C-S8p260 (segmented) and C-S8p260p3d (ST) FMDV in BHK-21 cells.
Cells were infected at a MOI of 20 PFU/cell. A to D) At different times after infection, the intracellular or extracellular concentration of genomic viral RNA (normalized to the number of cells) was determined. A) Intracellular concentration of viral RNA in two independent infections carried out in parallel; each value represents the average of two determinations. The data have been fitted to an exponential curve: C-S8p260: 4.8·102·e0.065×, R2 = 0.94; C-S8p260p3d :8.9·102·6e0.054×; R2 = 0.92. In B to D, BHK-21 cells were coinfected with the two viruses (C-S8p260 and C-S8p260p3d), at a MOI of 20 PFU/cell, and viral RNA was quantified as follows (symbols are as in A): B) Intracellular concentration of viral RNA in the course of virus entry into the cell. C) Intracellular viral RNA concentration during the exponential replication phase. D) Extracellular concentration of RNA measured in the cell culture supernatant obtained in the infection represented in C). In B–D the determinations were carried out from triplicate experiments (average values and standard deviation are shown). E) Electrophoretic analysis of 35S-labeled proteins extracted from BHK-21 cells electroporated with FMDV RNAs. BHK-21 cells were either mock-electroporated (BHK lanes) or electroporated with transcripts from either pMT260p3d or a mixture of viral transcripts from pMT260Δ417ns and pMT260Δ999ns (which give rise to C-S8p260p3d and C-S8p260, respectively; see Figure S2). Parallel cultures were pulse-labeled with [35S]Met/Cys for 30 min., at different times after 1 h post-electroporation, as indicated above each lane, and analyzed by PAGE, as described in Materials and Methods. The amount of cellular proteins was monitored by the relative amount of actin, visualized by Western-blot using a specific monoclonal antibody (actin panels). F) The amount of viral proteins VP3, VP1, 3D and 3CD (in arbitrary units) at each time point was determined by densitometric scanning of the corresponding protein bands, and normalized to the concentration of actin (top panels). Values were added sequentially at each time point to obtain the accumulated level of viral protein (bottom panels).
Figure 4
Figure 4. Dissection of the competition between C-S8p260 and C-S8p260p3d throughout sequential infectious cycles.
BHK-21 cells were infected at a final MOI 20 PFU/cell with equal PFU of C-S8p260 and C-S8p260p3d. Each point of the black line represents the average and standard deviation of the ratio of genomic C-S8p260 and C-S8p260p3d RNA molecules, in five independent infections (except for the initial inoculum which was measured in three infections). In the abscissa, “Inoculum” is the ratio of the two RNAs in the viral stock used in the experiment. “Entry 1” is the RNA ratio at 60 minutes post-inoculation. “Lysis1” is the RNA ratio after complete cytopathic effect. The virus obtained from “Lysis 1” was used as the inoculum to perform the next infection which produced “Entry 2” and “Lysis 2”. The infection to produce “Entry 3” was carried out with the virus obtained from “Lysis 2”. The numbers adjacent to the lines indicate the increase in frequency of the genotype C-S8p260 at the corresponding step. The grey line was constructed by estimating the differential decay (ds−1) of the two viruses (see Text S1) during the time frame of one infection; the line assumes the same initial (inoculum) value and the same replication rate between “Entry” and “Lysis” points determined experimentally. The inset graph represents the exponential fit of the ratios obtained for “Inoculum” (In.), “Lysis 1” (Lys.1), and “Lysis 2” (Lys.2) from the black line. The relative fitness value calculated from this plot is 1.9. Procedures are detailed in Materials and Methods.
Figure 5
Figure 5. Decay of infectivity of FMDV particles.
A) Equal volumes of C-S8p260p3d and C-S8p260 were incubated for two hours at 37°C or 0°C. The mean infectivity and standard error of triplicate experiments are plotted. B) Equal volumes of C-S8p260 and C-S8p260p3d were incubated at 37°C. Virus infectivity was determined, and plotted as a function of time. The decay of viral titer over time was fitted to a single exponential curve and the inactivation rate constant obtained. The equations that define the decay curves are: C-S8p260: y = 4·107·e−0.91·t, R2 = 0.995; C-S8p260p3d: y = 4·107·e−1.19·t, R2 = 0.982. C) BHK-21 cells were infected with equal number of PFUs of C-S8p260 and C-S8p260p3d, and the ratio of the two types of genomic RNA molecules was determined. “Inoculum 1” gives the RNA ratio in the viral stock used in the experiment. “Entry 1” indicates the RNA ratio at 60 minutes post-infection. When the cells reached complete cytopathic effect (“Lysis 1”), the supernatant was kept one additional hour at 37°C (350 minutes from the inoculation time). This supernatant corresponds to “Inoculum 2” and it was used to perform the next infection. “Entry 2” was measured after 60 minutes of infection with “Inoculum 2”. Results are the average of 3 determinations, and standard deviations are given. Procedures are described in Materials and Methods.
Figure 6
Figure 6. Computational model for the competition between ST and segmented forms.
A cell is infected by m viral particles. All particles replicate inside the cell at the same rate r, conditional on having complementary partners in case they are defective. In the example shown, the replication of population A is limited by the presence of only three particles (one of type B and two standard) able to complement them. This replication process is repeated in N cells, and the total viral populations are summed up (not specified in this scheme). Before the process starts anew, the total standard population is reduced by a factor ds, thus mimicking differential decay. For each cell at the next passage, a subset of m particles is randomly chosen among those remaining, and the process is repeated. B) The process described in A) has been iterated for 1000 passages. After that time, the composition of the population was analyzed. Triangles represent numerical results and indicate those parameter values where the composition changes from co-dominance (types A, B, and S present, above the triangles) to extinction of S (below); the line is a fit to the numerical data that yields the approximate relationship ds = 1−m(−1/2). C) Two representative examples of the kinetics of the ratio between the abundance of the population A and population S in the situations of extinction of the standard type (open circles in the upper curve correspond to the lower region in (A); ds = 0.5) and of co-dominance (solid circles in the lower curve are representantive of the upper domain in (A); ds = 0.85). Each curve yields the dynamics of the two points highlighted in (A) for m = 8, and the values of ds are as indicated. In the co-dominance region, the fraction of A and S abundances reaches a constant value; in the region where the S form becomes extinct, the abundance of A relative to S grows exponentially fast in successive passages until S is eventually displaced.

Similar articles

Cited by

References

    1. Garcia-Arriaza J, Manrubia SC, Toja M, Domingo E, Escarmis C. Evolutionary transition toward defective RNAs that are infectious by complementation. J Virol. 2004;78:11678–11685. - PMC - PubMed
    1. Garcia-Arriaza J, Ojosnegros S, Davila M, Domingo E, Escarmis C. Dynamics of mutation and recombination in a replicating population of complementing, defective viral genomes. J Mol Biol. 2006;360:558–572. - PubMed
    1. Nee S. The evolution of multicompartmental genomes in viruses. J Mol Evol. 1987;25:277–281. - PubMed
    1. Szathmary E. Natural selection and dynamical coexistence of defective and complementing virus segments. J Theor Biol. 1992;157:383–406. - PubMed
    1. Chao L. Evolution of sex in RNA viruses. J Theor Biol. 1988;133:99–112. - PubMed

Publication types