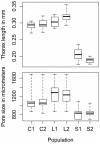
Population-based resequencing of experimentally evolved populations reveals the genetic basis of body size variation in Drosophila melanogaster
- PMID: 21437274
- PMCID: PMC3060078
- DOI: 10.1371/journal.pgen.1001336
Population-based resequencing of experimentally evolved populations reveals the genetic basis of body size variation in Drosophila melanogaster
Abstract
Body size is a classic quantitative trait with evolutionarily significant variation within many species. Locating the alleles responsible for this variation would help understand the maintenance of variation in body size in particular, as well as quantitative traits in general. However, successful genome-wide association of genotype and phenotype may require very large sample sizes if alleles have low population frequencies or modest effects. As a complementary approach, we propose that population-based resequencing of experimentally evolved populations allows for considerable power to map functional variation. Here, we use this technique to investigate the genetic basis of natural variation in body size in Drosophila melanogaster. Significant differentiation of hundreds of loci in replicate selection populations supports the hypothesis that the genetic basis of body size variation is very polygenic in D. melanogaster. Significantly differentiated variants are limited to single genes at some loci, allowing precise hypotheses to be formed regarding causal polymorphisms, while other significant regions are large and contain many genes. By using significantly associated polymorphisms as a priori candidates in follow-up studies, these data are expected to provide considerable power to determine the genetic basis of natural variation in body size.
Conflict of interest statement
The authors have declared that no competing interests exist.
Figures


References
-
- De Jong G, Bochdanovits Z. Latitudinal clines in Drosophila melanogaster: body size, allozyme frequencies, inversion frequencies, and the insulin-signalling pathway. Journal of Genetics. 2003;82:207–223. - PubMed
-
- Capy P, Pla E, David JR. Phenotypic and genetic variability of morphometrical traits in natural populations of Drosophila melanogaster and D. simulans. I. Geographic variations. Genetics, Selection, Evolution. 1993;25:517–536.
-
- Partridge L, Barrie B, Fowler K, French V. Evolution and development of body size and cell size in Drosophila melanogaster in response to temperature. Evolution. 1994;48:1269–1276. - PubMed
-
- Prasad NG, Bedhomme S, Day T, Chippindale AK. An evolutionary cost of separate genders revealed by male-limited evolution. American Naturalist. 2007;169:29–37. - PubMed
Publication types
MeSH terms
Grants and funding
LinkOut - more resources
Full Text Sources
Molecular Biology Databases
Research Materials

