

Modeling and analysis of retinoic acid induced differentiation of uncommitted precursor cells
- PMID: 21437295
- PMCID: PMC3685823
- DOI: 10.1039/c0ib00141d
Modeling and analysis of retinoic acid induced differentiation of uncommitted precursor cells
Abstract
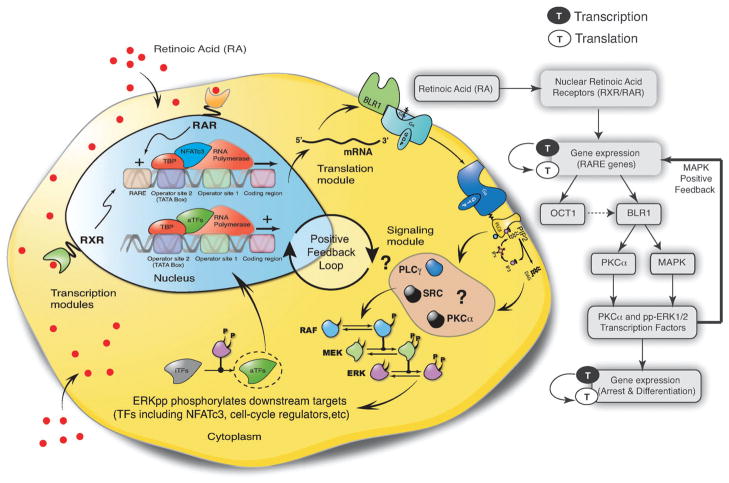
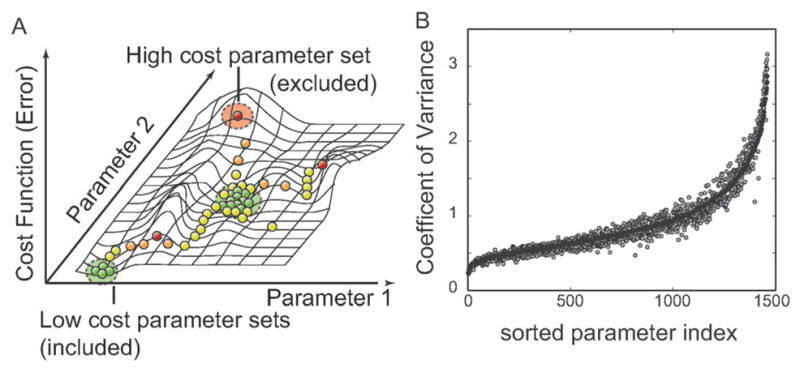
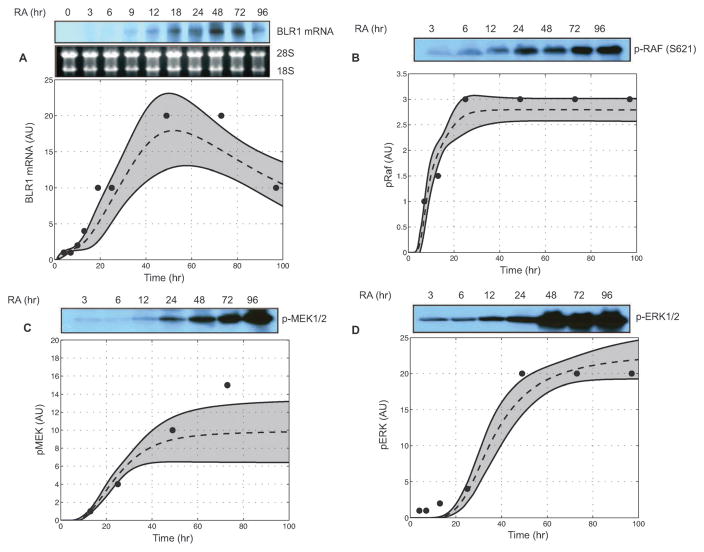
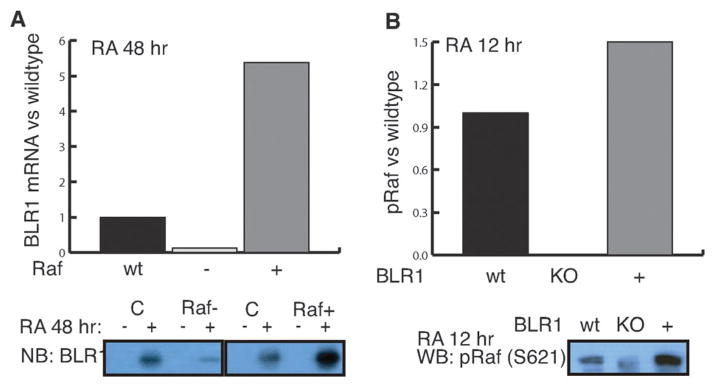
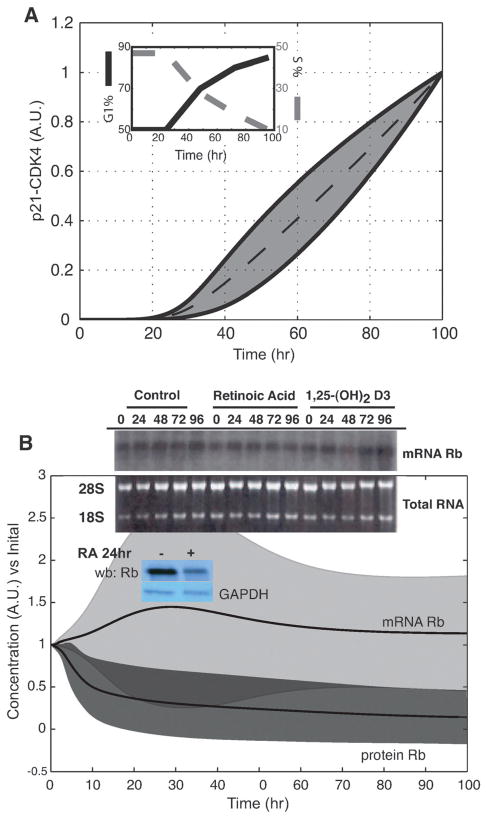
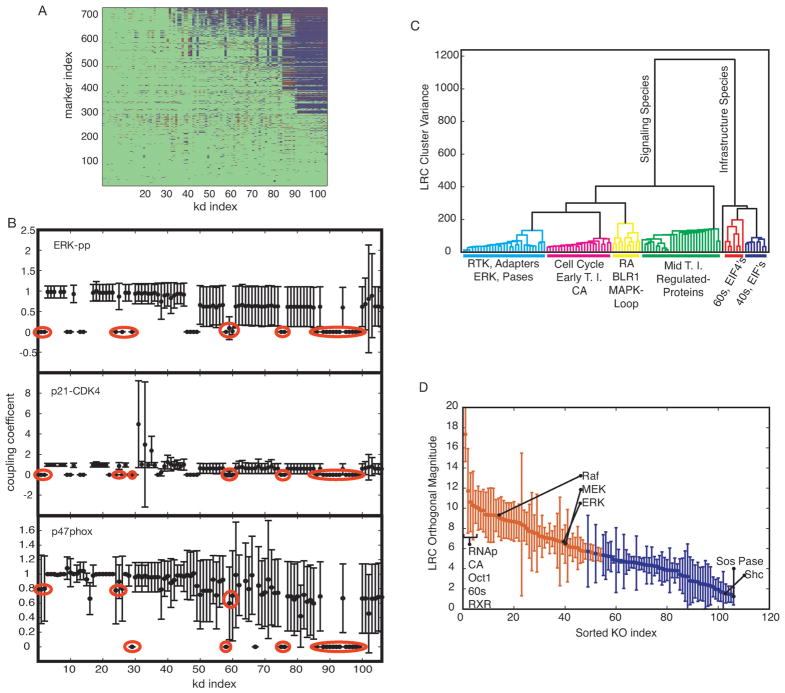
Manipulation of differentiation programs has therapeutic potential in a spectrum of human cancers and neurodegenerative disorders. In this study, we integrated computational and experimental methods to unravel the response of a lineage uncommitted precursor cell-line, HL-60, to Retinoic Acid (RA). HL-60 is a human myeloblastic leukemia cell-line used extensively to study human differentiation programs. Initially, we focused on the role of the BLR1 receptor in RA-induced differentiation and G1/0-arrest in HL-60. BLR1, a putative G protein-coupled receptor expressed following RA exposure, is required for RA-induced cell-cycle arrest and differentiation and causes persistent MAPK signaling. A mathematical model of RA-induced cell-cycle arrest and differentiation was formulated and tested against BLR1 wild-type (wt) knock-out and knock-in HL-60 cell-lines with and without RA. The current model described the dynamics of 729 proteins and protein complexes interconnected by 1356 interactions. An ensemble strategy was used to compensate for uncertain model parameters. The ensemble of HL-60 models recapitulated the positive feedback between BLR1 and MAPK signaling. The ensemble of models also correctly predicted Rb and p47phox regulation and the correlation between p21-CDK4-cyclin D formation and G1/0-arrest following exposure to RA. Finally, we investigated the robustness of the HL-60 network architecture to structural perturbations and generated experimentally testable hypotheses for future study. Taken together, the model presented here was a first step toward a systematic framework for analysis of programmed differentiation. These studies also demonstrated that mechanistic network modeling can help prioritize experimental directions by generating falsifiable hypotheses despite uncertainty.
Figures
Similar articles
-
A MAPK-positive feedback mechanism for BLR1 signaling propels retinoic acid-triggered differentiation and cell cycle arrest.J Biol Chem. 2008 Feb 15;283(7):4375-86. doi: 10.1074/jbc.M708471200. Epub 2007 Nov 15. J Biol Chem. 2008. PMID: 18006504
-
Retinoic acid-induced blr1 expression requires RARalpha, RXR, and MAPK activation and uses ERK2 but not JNK/SAPK to accelerate cell differentiation.Eur J Cell Biol. 2001 Jan;80(1):59-67. doi: 10.1078/0171-9335-00141. Eur J Cell Biol. 2001. PMID: 11211936
-
Retinoic acid-induced blr1 expression promotes ERK2 activation and cell differentiation in HL-60 cells.Exp Cell Res. 2000 Feb 1;254(2):287-98. doi: 10.1006/excr.1999.4766. Exp Cell Res. 2000. PMID: 10640427
-
6-Formylindolo (3,2-b)carbazole (FICZ) enhances retinoic acid (RA)-induced differentiation of HL-60 myeloblastic leukemia cells.Mol Cancer. 2013 May 9;12:39. doi: 10.1186/1476-4598-12-39. Mol Cancer. 2013. PMID: 23656719 Free PMC article.
-
FGR Src family kinase causes signaling and phenotypic shift mimicking retinoic acid-induced differentiation of leukemic cells.Oncotarget. 2025 Mar 21;16:202-218. doi: 10.18632/oncotarget.28705. Oncotarget. 2025. PMID: 40116400 Free PMC article.
Cited by
-
Differential effects of retinoids and inhibitors of ERK and p38 signaling on adipogenic and myogenic differentiation of P19 stem cells.Stem Cells Dev. 2013 Jul 15;22(14):2003-16. doi: 10.1089/scd.2012.0209. Epub 2013 Apr 1. Stem Cells Dev. 2013. PMID: 23441952 Free PMC article.
-
Solving the lost in translation problem: improving the effectiveness of translational research.Curr Opin Pharmacol. 2013 Feb;13(1):108-14. doi: 10.1016/j.coph.2012.08.005. Epub 2012 Sep 11. Curr Opin Pharmacol. 2013. PMID: 22980732 Free PMC article. Review.
-
Toward a genome scale sequence specific dynamic model of cell-free protein synthesis in Escherichia coli.Metab Eng Commun. 2019 Dec 4;10:e00113. doi: 10.1016/j.mec.2019.e00113. eCollection 2020 Jun. Metab Eng Commun. 2019. PMID: 32280586 Free PMC article.
-
An Effective Model of the Retinoic Acid Induced HL-60 Differentiation Program.Sci Rep. 2017 Oct 30;7(1):14327. doi: 10.1038/s41598-017-14523-5. Sci Rep. 2017. PMID: 29085021 Free PMC article.
-
Computational modeling and analysis of insulin induced eukaryotic translation initiation.PLoS Comput Biol. 2011 Nov;7(11):e1002263. doi: 10.1371/journal.pcbi.1002263. Epub 2011 Nov 10. PLoS Comput Biol. 2011. PMID: 22102801 Free PMC article.
References
-
- Chen X, Xu H, Yuan P, Fang F, Huss M, Vega VB, Wong E, Orlov YL, Zhang W, Jiang J, Loh YH, Yeo HC, Yeo ZX, Narang V, Govindarajan KR, Leong B, Shahab A, Ruan Y, Bourque G, Sung WK, Clarke ND, Wei CL, Ng HH. Cell. 2008;133:1106–17. - PubMed
-
- Collins SJ, Gallo RC, Gallagher RE. Nature. 1977;270:347–349. - PubMed
-
- Yen A. Hematology Review. 1990;4:5–46.
-
- Yen A, Roberson MS, Varvayanis S, Lee AT. Cancer Res. 1998;58:3163–72. - PubMed
Publication types
MeSH terms
Substances
Grants and funding
LinkOut - more resources
Full Text Sources
