

DNA methylation-mediated silencing of nonsteroidal anti-inflammatory drug-activated gene (NAG-1/GDF15) in glioma cell lines
- PMID: 21437897
- PMCID: PMC3133861
- DOI: 10.1002/ijc.26082
DNA methylation-mediated silencing of nonsteroidal anti-inflammatory drug-activated gene (NAG-1/GDF15) in glioma cell lines
Abstract
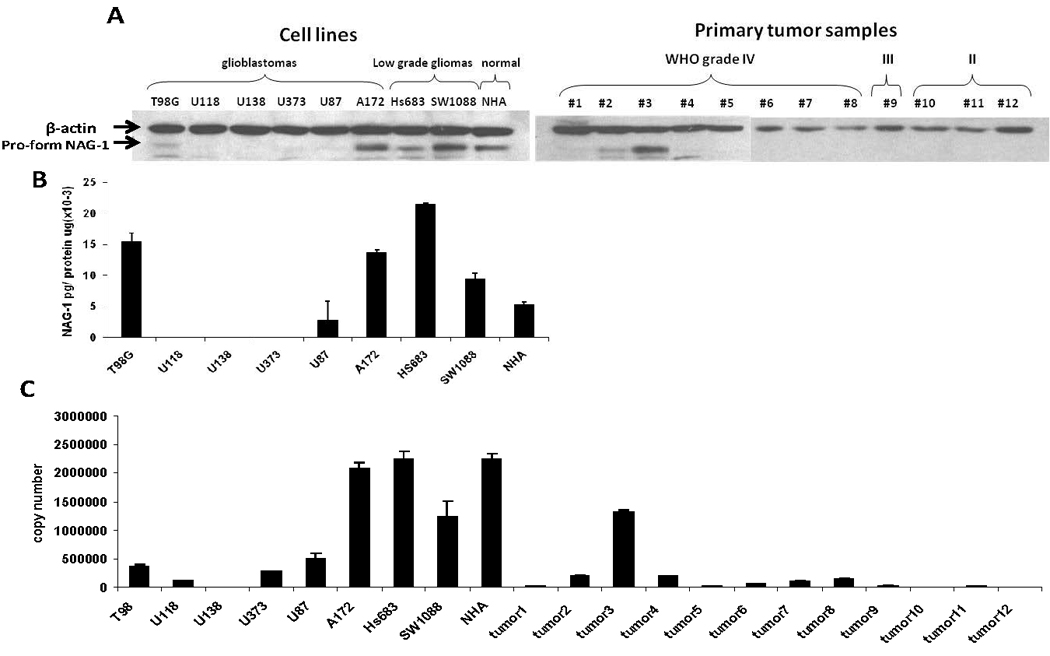
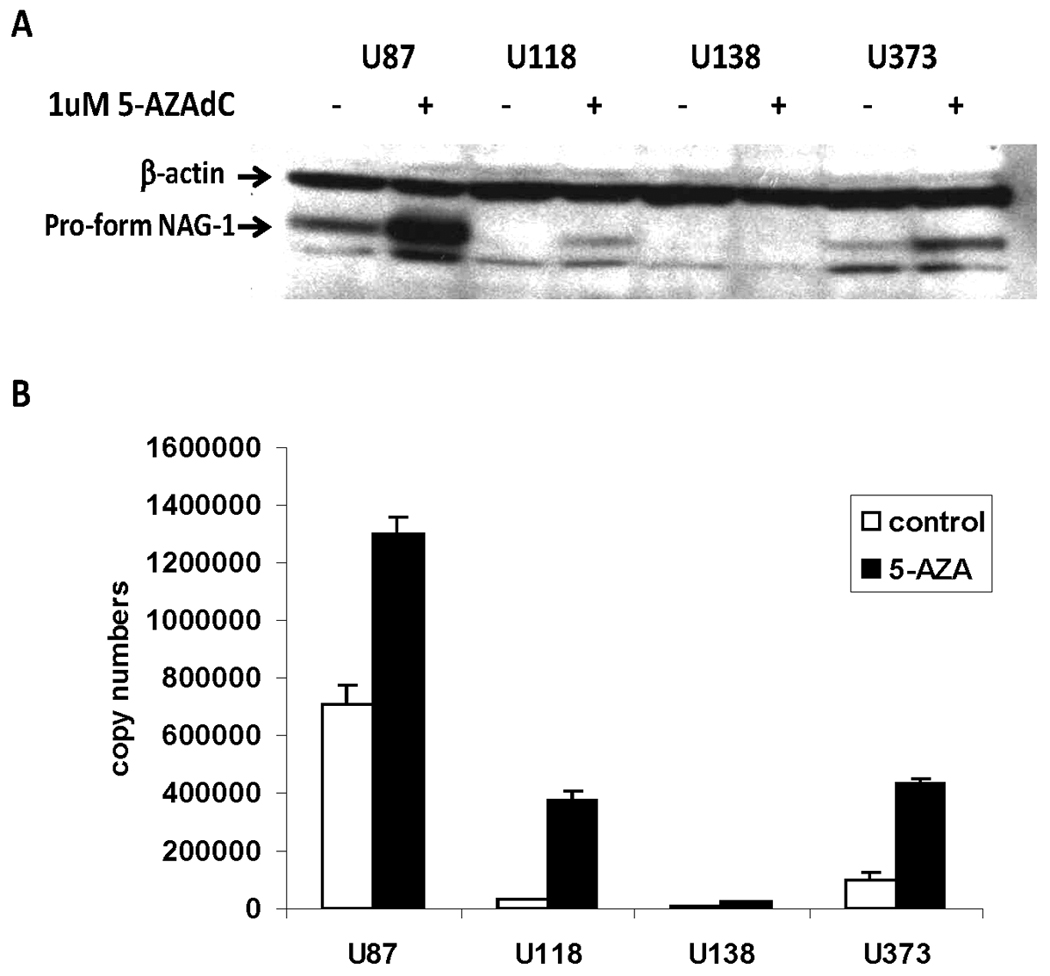
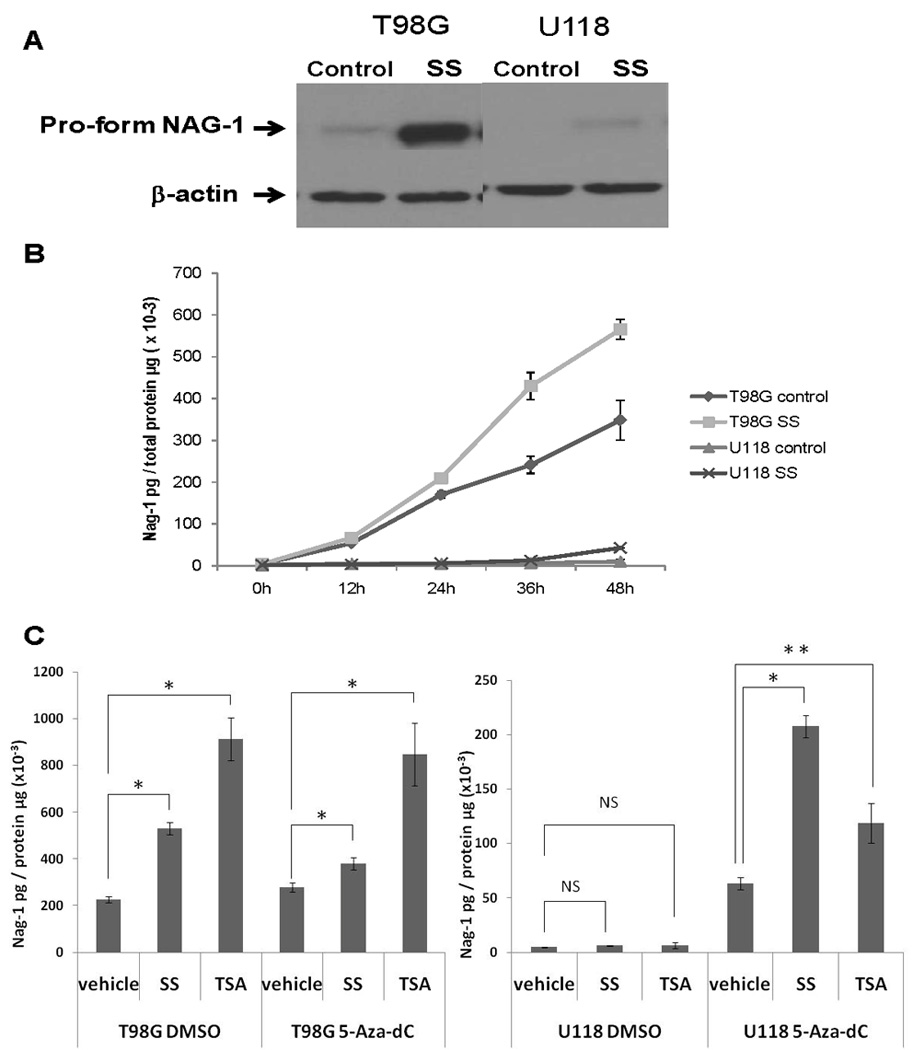
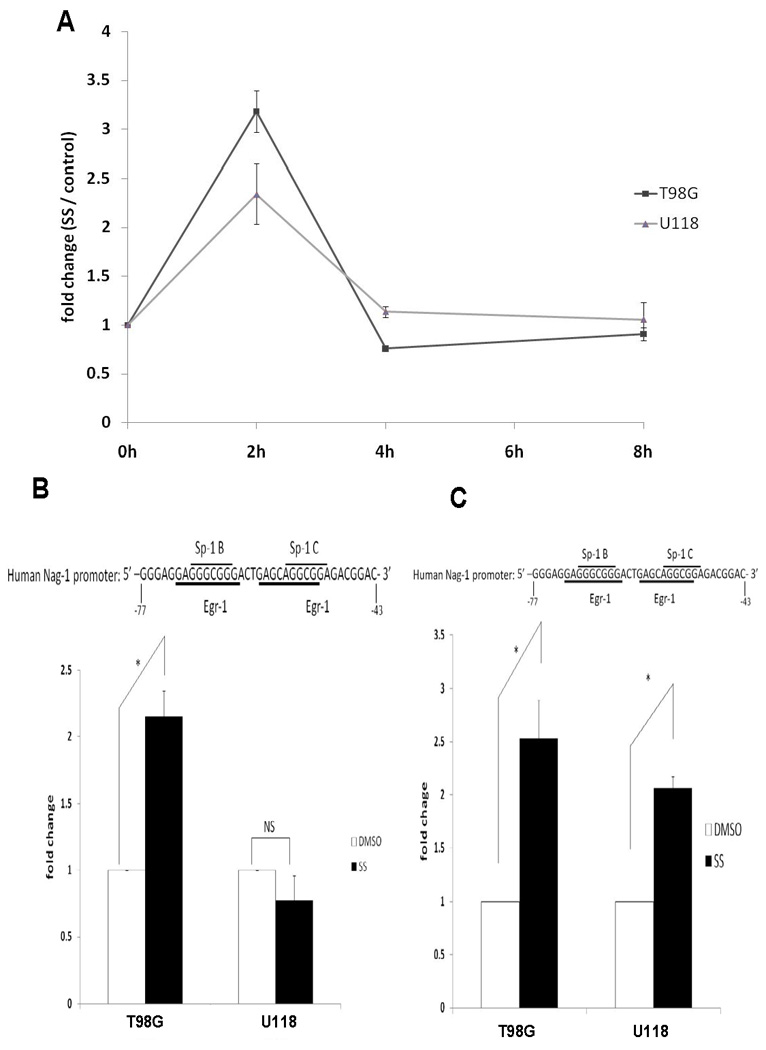
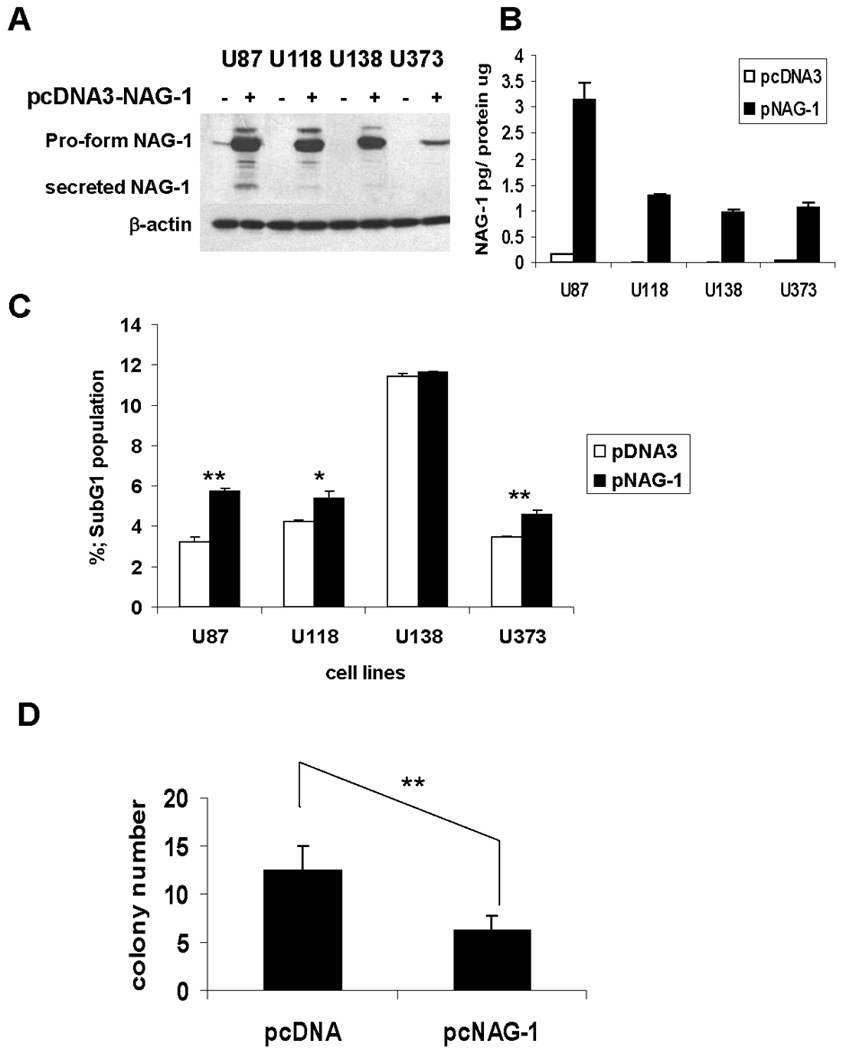
Nonsteroidal anti-inflammatory drug-activated gene, NAG-1, a transforming growth factor-β member, is involved in tumor progression and development. The association between NAG-1 expression and development and progression of glioma has not been well defined. Glioblastoma cell lines have lower basal expression of NAG-1 than other gliomas and normal astrocytes. Most primary human gliomas have very low levels of NAG-1 expression. NAG-1 basal expression appeared to inversely correlate with tumor grade in glioma. Aberrant promoter hypermethylation is a common mechanism for silencing of tumor suppressor genes in cancer cells. In glioblastoma cell lines, NAG-1 expression was increased by the demethylating agent, 5-aza-2'-deoxycytidine. To investigate whether the NAG-1 gene was silenced by hypermethylation in glioblastoma, we examined DNA methylation status using genomic bisulfite sequencing. The NAG-1 promoter was densely methylated in several glioblastoma cell lines as well as in primary oligodendroglioma tumor samples, which have low basal expression of NAG-1. DNA methylation at two specific sites (-53 and +55 CpG sites) in the NAG-1 promoter was strongly associated with low NAG-1 expression. The methylation of the NAG-1 promoter at the -53 site blocks Egr-1 binding and thereby suppresses Nag-1 induction. Treatment of cells with low basal NAG-1 expression with NAG-1 inducer also did not increase NAG-1. Incubation with a demethylation chemical increased Nag-1 basal expression and subsequent incubation with a NAG-1 inducer increased NAG-1 expression. We concluded from these data that methylation of specific promoter sequences causes transcriptional silencing of the NAG-1 locus in glioma and may ultimately contribute to tumor progression.
Copyright © 2011 UICC.
Figures
Similar articles
-
Nonsteroidal anti-inflammatory drug-activated gene (NAG-1/GDF15) expression is increased by the histone deacetylase inhibitor trichostatin A.J Biol Chem. 2008 Nov 28;283(48):33129-37. doi: 10.1074/jbc.M805248200. Epub 2008 Sep 17. J Biol Chem. 2008. PMID: 18801729 Free PMC article.
-
Epigenomic profiling reveals novel and frequent targets of aberrant DNA methylation-mediated silencing in malignant glioma.Cancer Res. 2006 Aug 1;66(15):7490-501. doi: 10.1158/0008-5472.CAN-05-4552. Cancer Res. 2006. PMID: 16885346
-
Promoter methylation and silencing of the tissue factor pathway inhibitor-2 (TFPI-2), a gene encoding an inhibitor of matrix metalloproteinases in human glioma cells.Oncogene. 2003 Jul 17;22(29):4509-16. doi: 10.1038/sj.onc.1206695. Oncogene. 2003. PMID: 12881707
-
Methylation Status of the RIZ1 Gene Promoter in Human Glioma Tissues and Cell Lines.Cell Mol Neurobiol. 2017 Aug;37(6):1021-1027. doi: 10.1007/s10571-016-0435-3. Epub 2016 Oct 18. Cell Mol Neurobiol. 2017. PMID: 27757741 Free PMC article.
-
The diverse roles of nonsteroidal anti-inflammatory drug activated gene (NAG-1/GDF15) in cancer.Biochem Pharmacol. 2013 Mar 1;85(5):597-606. doi: 10.1016/j.bcp.2012.11.025. Epub 2012 Dec 7. Biochem Pharmacol. 2013. PMID: 23220538 Free PMC article. Review.
Cited by
-
Growth differentiation factor 15 (GDF15): A survival protein with therapeutic potential in metabolic diseases.Pharmacol Ther. 2019 Jun;198:46-58. doi: 10.1016/j.pharmthera.2019.02.008. Epub 2019 Feb 18. Pharmacol Ther. 2019. PMID: 30790643 Free PMC article. Review.
-
Batokine in Central Nervous System Diseases.Mol Neurobiol. 2023 Dec;60(12):7021-7031. doi: 10.1007/s12035-023-03490-w. Epub 2023 Aug 1. Mol Neurobiol. 2023. PMID: 37526894 Review.
-
Emerging roles of growth differentiation factor-15 in brain disorders (Review).Exp Ther Med. 2021 Nov;22(5):1270. doi: 10.3892/etm.2021.10705. Epub 2021 Sep 7. Exp Ther Med. 2021. PMID: 34594407 Free PMC article. Review.
-
Transcriptional Regulation of GDF15 by EGR1 Promotes Head and Neck Cancer Progression through a Positive Feedback Loop.Int J Mol Sci. 2021 Oct 15;22(20):11151. doi: 10.3390/ijms222011151. Int J Mol Sci. 2021. PMID: 34681812 Free PMC article.
-
Curcumin-Induced Molecular Mechanisms in U-87 MG Glioblastoma Cells: Insights from Global Gene Expression Profiling.Molecules. 2025 May 9;30(10):2108. doi: 10.3390/molecules30102108. Molecules. 2025. PMID: 40430278 Free PMC article.
References
-
- Mischel PS, Cloughesy TF, Nelson SF. DNA-microarray analysis of brain cancer: molecular classification for therapy. Nature reviews. 2004;5:782–792. - PubMed
-
- Ohgaki H, Kleihues P. Epidemiology and etiology of gliomas. Acta neuropathologica. 2005;109:93–108. - PubMed
-
- Ohgaki H, Dessen P, Jourde B, Horstmann S, Nishikawa T, Di Patre PL, Burkhard C, Schuler D, Probst-Hensch NM, Maiorka PC, Baeza N, Pisani P, et al. Genetic pathways to glioblastoma: a population-based study. Cancer research. 2004;64:6892–6899. - PubMed
-
- Watanabe K, Sato K, Biernat W, Tachibana O, von Ammon K, Ogata N, Yonekawa Y, Kleihues P, Ohgaki H. Incidence and timing of p53 mutations during astrocytoma progression in patients with multiple biopsies. Clin Cancer Res. 1997;3:523–530. - PubMed
-
- Watanabe K, Tachibana O, Sata K, Yonekawa Y, Kleihues P, Ohgaki H. Overexpression of the EGF receptor and p53 mutations are mutually exclusive in the evolution of primary and secondary glioblastomas. Brain pathology (Zurich, Switzerland) 1996;6:217–223. discussion 23–4. - PubMed
Publication types
MeSH terms
Substances
Grants and funding
LinkOut - more resources
Full Text Sources
Medical
