. 2012 Jan;33(1):63-74.
doi: 10.1002/hbm.21193. Epub 2011 Mar 24.

Effects of attentional load on early visual processing depend on stimulus timing

Affiliations

Effects of attentional load on early visual processing depend on stimulus timing

Karsten Rauss et al. Hum Brain Mapp. 2012 Jan.

Abstract

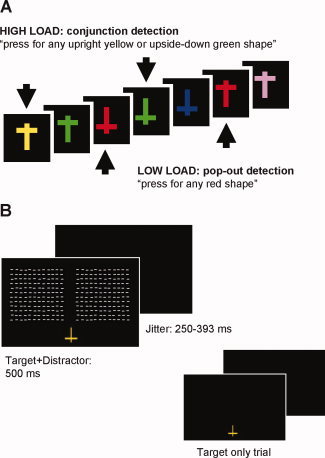
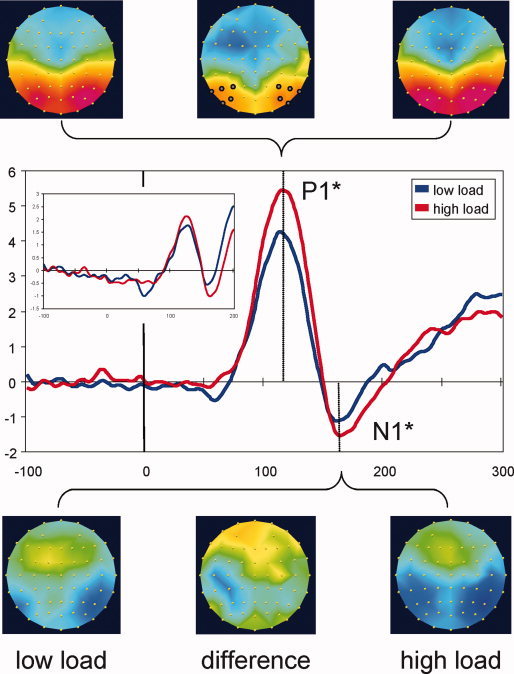
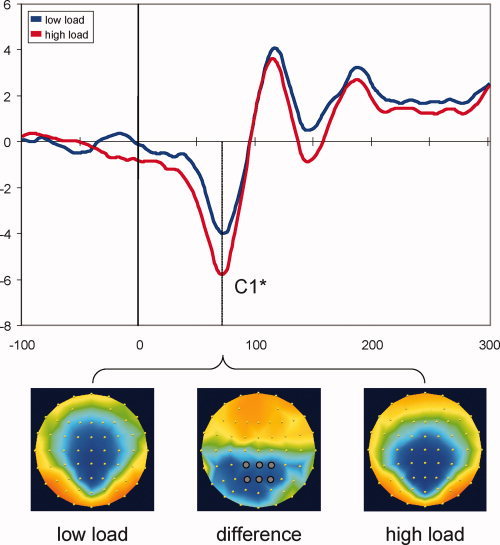
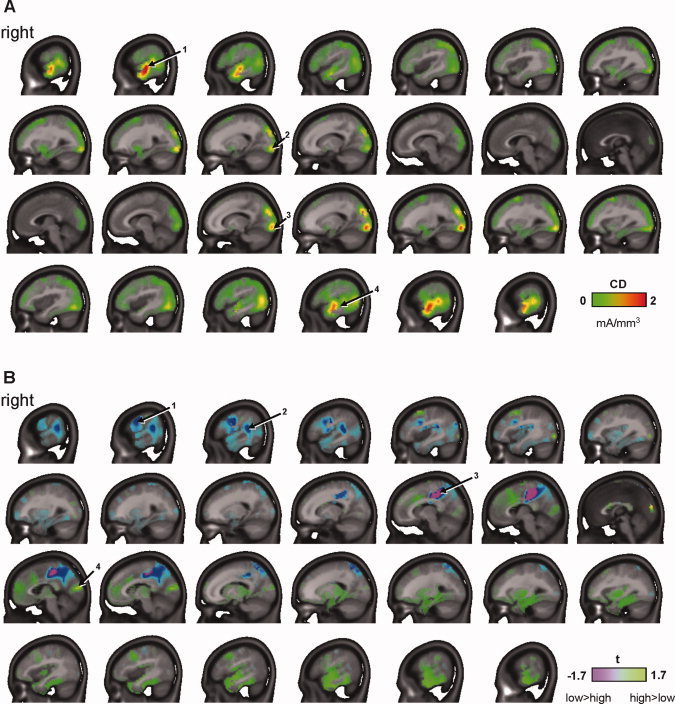
A growing number of studies suggest that early visual processing is not only affected by low-level perceptual attributes but also by higher order cognitive factors such as attention or emotion. Using high-density electroencephalography, we recently demonstrated that attentional load of a task at fixation reduces the response of primary visual cortex to irrelevant peripheral stimuli, as indexed by the C1 component. In the latter study, peripheral stimuli were always presented during intervals without task-relevant stimuli. Here, we use a similar paradigm but present central task stimuli and irrelevant peripheral stimuli simultaneously while keeping all other stimulus characteristics constant. Results show that rather than to suppress responses to peripheral stimulation, high attentional load elicits higher C1 amplitudes under these conditions. These findings suggest that stimulus timing can profoundly alter the effects of attentional load on the earliest stages of processing in human visual cortex.


Figures

Figure 1
Figure 1
Experimental paradigm. A: During EEG recording, subjects performed either an easy (color pop‐out detection) or a more demanding (color/orientation conjunction detection) task on the same stream of centrally presented stimuli. B: Irrelevant probes were presented simultaneously with the central stimulus on 22% of trials, with approximately equal proportions of target and nontarget central stimuli accompanied by peripheral probes (see Methods). [Color figure can be viewed in the online issue, which is available at wileyonlinelibrary.com.]
Figure 2
Figure 2
Task‐only VEPs. Waveforms show VEPs elicited by nonimperative central task stimuli in the absence of peripheral probes and represent grand averages across 10 lateral posterior electrodes highlighted on the top‐central map. Topographic maps are shown for the P1 (115 ms) and N1 (165 ms) peak latencies, for low‐load and high‐load conditions (scaled to ±5 μV) as well as their difference (high load minus low load, scaled to ±2.5 μV). N1 differences were significant when measured peak‐to‐peak (N1 minus P1). The inset shows the average across six central posterior electrodes used for C1 analyses (see below) and indicates that a C1 component was absent following foveal stimulation. *P < 0.05. [Color figure can be viewed in the online issue, which is available at wileyonlinelibrary.com.]
Figure 3
Figure 3
Task‐plus‐probe VEPs. Waveforms show VEPs elicited by non‐imperative task stimuli accompanied by peripheral probes, averaged across six central posterior electrodes highlighted on the central map. C1 activity is largely determined by the peripheral stimulation (compare with Fig. 2). C1 peak amplitudes differed significantly between load conditions, with higher probe‐related activity in the high‐load condition. Topographic maps are shown for the C1 peak latency (75 ms), separately for low‐ and high‐load conditions (scaled to ±5 μV), as well as their difference (high load minus low load, scaled to ±2.5 μV). *P < 0.05. [Color figure can be viewed in the online issue, which is available at wileyonlinelibrary.com.]
Figure 4
Figure 4
Results of distributed inverse solutions using LAURA. Sagittal slices are shown from right (top) to left (bottom). A: Inverse solutions over the C1 interval (45–70 ms), averaged across subjects and load conditions. Principal activation foci were located bilaterally in lower visual cortex (2, 3) and middle temporal cortex (1, 4). Data shown are current densities (CDs) in mA/mm3. B: Inverse solutions were compared between load conditions for each subject using paired point‐by‐point t‐tests (high minus low load) and subsequently averaged over the C1 interval and across subjects. Maps of t‐values shown are scaled to P = 0.10 for df = 13. Results indicated higher activity under low load in regions including right FEF (1), right TPJ (2), and bilateral PCC (3). In accordance with VEP results, a marginally significant increase in activity under high load was observed in the cuneus bilaterally (4). [Color figure can be viewed in the online issue, which is available at wileyonlinelibrary.com.]

Similar articles

Cited by

References

    1. Ales J, Carney T, Klein SA ( 2010): The folding fingerprint of visual cortex reveals the timing of human V1 and V2. Neuroimage 49: 2494–2502. - PMC - PubMed
    1. Amunts K, Malikovic A, Mohlberg H, Schormann T, Zilles K ( 2000): Brodmann's areas 17 and 18 brought into stereotaxic space—Where and how variable? Neuroimage 11: 66–84. - PubMed
    1. Bahcall DO, Kowler E ( 1999): Attentional interference at small spatial separations. Vis Res 39: 71–86. - PubMed
    1. Blake R, Lee S‐H ( 2005): The role of temporal structure in human vision. Behav Cogn Neurosci Rev 4: 21–42. - PubMed
    1. Brefczynski JA, DeYoe EA ( 1999): A physiological correlate of the ‘spotlight’ of visual attention. Nat Neurosci 2: 370–374. - PubMed

Publication types

LinkOut - more resources