. 2011 Jun;164(3):373-80.
doi: 10.1111/j.1365-2249.2011.04383.x. Epub 2011 Mar 25.

Regulatory T cells and chronic immune activation in human immunodeficiency virus 1 (HIV-1)-infected children

Affiliations

Regulatory T cells and chronic immune activation in human immunodeficiency virus 1 (HIV-1)-infected children

R Freguja et al. Clin Exp Immunol. 2011 Jun.

Abstract

The function of CD4(+) T cells with regulatory activity (T(regs)) is the down-regulation of immune responses. This suppressive activity may limit the magnitude of effector responses, resulting in failure to control human immunodeficiency virus 1 (HIV-1) infection, but may also suppress chronic immune activation, a characteristic feature of HIV-1 disease. We evaluated the correlation between viral load, immune activation and T(regs) in HIV-1-infected children. Eighty-nine HIV-1-infected children (aged 6-14 years) were included in the study and analysed for HIV-1 plasmaviraemia, HIV-1 DNA load, CD4 and CD8 cell subsets. T(reg) cells [CD4(+)CD25(high)CD127(low) forkhead box P3 (FoxP3(high))] and CD8-activated T cells (CD8(+)CD38(+)) were determined by flow cytometry. Results showed that the number of activated CD8(+)CD38(+)T cells increased in relation to HIV-1 RNA plasmaviraemia (r = 0·403, P < 0·0001). The proportion of T(regs) also correlated positively with HIV-1 plasmaviraemia (r = 0·323, P = 0·002), but correlated inversely with CD4(+) cells (r = -0·312, P = 0·004), thus suggesting a selective expansion along with increased viraemia and CD4(+) depletion. Interestingly, a positive correlation was found between the levels of T(regs) and CD8(+)CD38(+)T cells (r = 0·305, P = 0·005), and the percentage of T(regs) tended to correlate with HIV-1 DNA load (r = 0·224, P = 0·062). Overall, these findings suggest that immune activation contributes to the expansion of T(reg) cells. In turn, the suppressive activity of T(regs) may impair effector responses against HIV-1, but appears to be ineffective in limiting immune activation.


Figures

Fig. 1
Fig. 1
Flow cytometric panels showing the gating strategy. Peripheral blood mononuclear cells were gated on CD4+ lymphocytes (based on side light-scatter and CD4 staining) and analysed for (a) CD25 and forkhead box P3 (FoxP3) expression and (b) CD25 and CD127 expression. (c) Histogram representing CD127 expression on the gate R1 (CD25hiFoxP3hi). (d) Histogram representing FoxP3 expression on the gate R2 (CD25hiCD127lo). Mouse IgG1k Alexa 488 and IgG1k Alexa 647 were used as isotype controls for intracytoplasmatic FoxP3 and membrane CD127 staining, respectively.
Fig. 2
Fig. 2
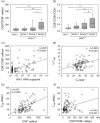
Immunological status of human immunodeficiency virus 1 (HIV-1)-infected children. (a) CD4+ T cells; (b) CD4+CD45RA- T cells; (c) CD8+ T cells; (d) CD8+CD45RA- T cells in HIV-1-uninfected and HIV-1-infected children subgrouped according to HIV-1 plasmaviraemia (group 1 = HIV-1 RNA < 50 copies/ml; group 2 = 50 < HIV-1 RNA < 1000 copies/ml; group 3 = HIV-1 RNA > 1000 copies/ml). Boxes and whiskers represent the 25–75th and 10–90th percentiles, respectively; the median is the central line in each box.*P < 0·05; **P < 0·001.
Fig. 3
Fig. 3
Regulatory T cells (Tregs) in human immunodeficiency virus 1 (HIV-1)-infected children. (a) Percentage of Tregs in HIV-1-uninfected and HIV-1-infected children subgrouped according to HIV-1 plasmaviraemia. Boxes and whiskers represent the 25–75th and 10–90th percentiles, respectively; the median is the central line in each box. (b) Relationship between number of CD4+ cells and number of Tregs in HIV-1-infected children. (c) Relationship between number of CD4+ cells and percentage of Tregs in HIV-1-infected children. (d) Tregs/CD4 cell ratio in HIV-1-uninfected and HIV-1-infected children, subgrouped according to HIV-1 plasmaviraemia. Boxes and whiskers represent the 25–75th and 10–90th percentiles, respectively; the median is the central line in each box (group 1 = HIV-1 RNA < 50 copies/ml; group 2 = 50 < HIV-1 RNA < 1000 copies/ml; group 3 = HIV-1 RNA > 1000 copies/ml).*P < 0·05; **P < 0·001.
Fig. 4
Fig. 4
Relationship between regulatory T cells (Tregs) and immune activation. (a) CD8+CD38+ T cells and (b) CD8+CD38+/CD8+ ratio in human immunodeficiency virus 1 (HIV-1)-uninfected and HIV-1-infected children subgrouped according to HIV-1 plasmaviraemia (group 1 = HIV-1 RNA < 50 copies/ml; group 2 = 50 < HIV-1 RNA < 1000 copies/ml; group 3 = HIV-1 RNA > 1000 copies/ml). Boxes and whiskers represent the 25–75th and 10–90th percentiles; the median is the central line in each box. (c) Relationship between levels of HIV-1 plasmaviraemia (HIV-1 RNA copies/ml) and number of CD8+CD38+ T cells. (d) Relationship between percentages of Tregs and CD8+ cells in HIV-1-infected children. (e) Relationship between numbers of Tregs and CD8+ cells in HIV-1-infected children. (f) Relationship between numbers of CD8+CD38+ T cells and Tregs in HIV-1-infected children. *P < 0·05; **P < 0·001.
Fig. 5
Fig. 5
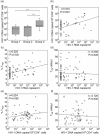
Relationship between human immunodeficiency virus 1 (HIV-1) DNA, HIV-1 RNA and regulatory T cells (Tregs). (a) Levels of HIV-1 DNA in CD4+ T cells in HIV-1-infected children subgrouped according to HIV-1 plasmaviraemia (group 1 = HIV-1 RNA < 50 copies/ml; group 2 = 50 < HIV-1 RNA < 1000 copies/ml; group 3 = HIV-1 RNA > 1000 copies/ml). Boxes and whiskers represent the 25–75th and 10–90th percentiles, respectively; the median is the central line in each box. (b) Correlation between HIV-1 RNA plasmaviraemia and HIV-1 DNA load. (c) Relationship between HIV-1 RNA plasmaviraemia and percentage of Tregs. (d) Relationship between HIV-1 RNA plasmaviraemia and number of Tregs. (e) Relationship between HIV-1 DNA load and percentage of Tregs. (f) Relationship between HIV-1 DNA load and number of Tregs. **P < 0·001.

References

    1. Hazenberg MD, Otto SA, van Benthem BHB, et al. Persistent immune activation in HIV-1 infection is associated with progression to AIDS. AIDS. 2003;17:1881–8. - PubMed
    1. Okoye A, Meier-Schellersheim M, Brenchley JM, et al. Progressive CD4+ central memory T cell decline results in CD4+ effector memory insufficiency and overt disease in chronic SIV infection. J Exp Med. 2007;204:2171–85. - PMC - PubMed
    1. Douek DC, Picker LJ, Koup RA. T cell dynamics in HIV-1 infection. Annu Rev Immunol. 2003;21:265–304. - PubMed
    1. Grossman Z, Feinberg MB, Paul WE. Multiple modes of cellular activation and virus transmission in HIV infection: a role for chronically and latently infected cells in sustaining viral replication. Proc Natl Acad Sci USA. 1998;95:6314–9. - PMC - PubMed
    1. Hunt PW, Martin JN, Sinclair E, et al. T cell activation is associated with lower CD4+ T cell gains in human immunodeficiency virus-infected patients with sustained viral suppression during antiretroviral therapy. J Infect Dis. 2003;187:1534–43. - PubMed

Publication types

MeSH terms