

Center/surround organization of retinal bipolar cells: High correlation of fundamental responses of center and surround to sinusoidal contrasts
- PMID: 21439110
- PMCID: PMC3437648
- DOI: 10.1017/S0952523811000071
Center/surround organization of retinal bipolar cells: High correlation of fundamental responses of center and surround to sinusoidal contrasts
Abstract
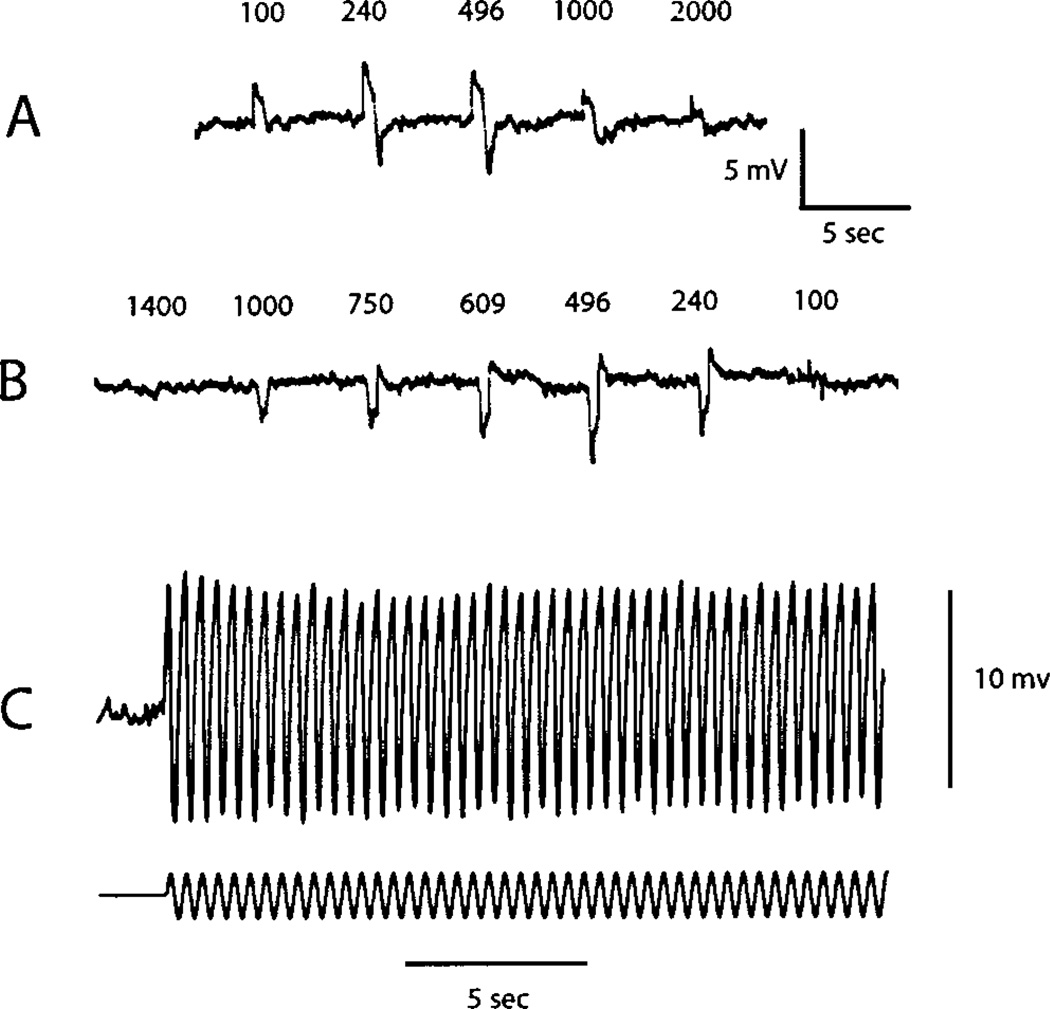
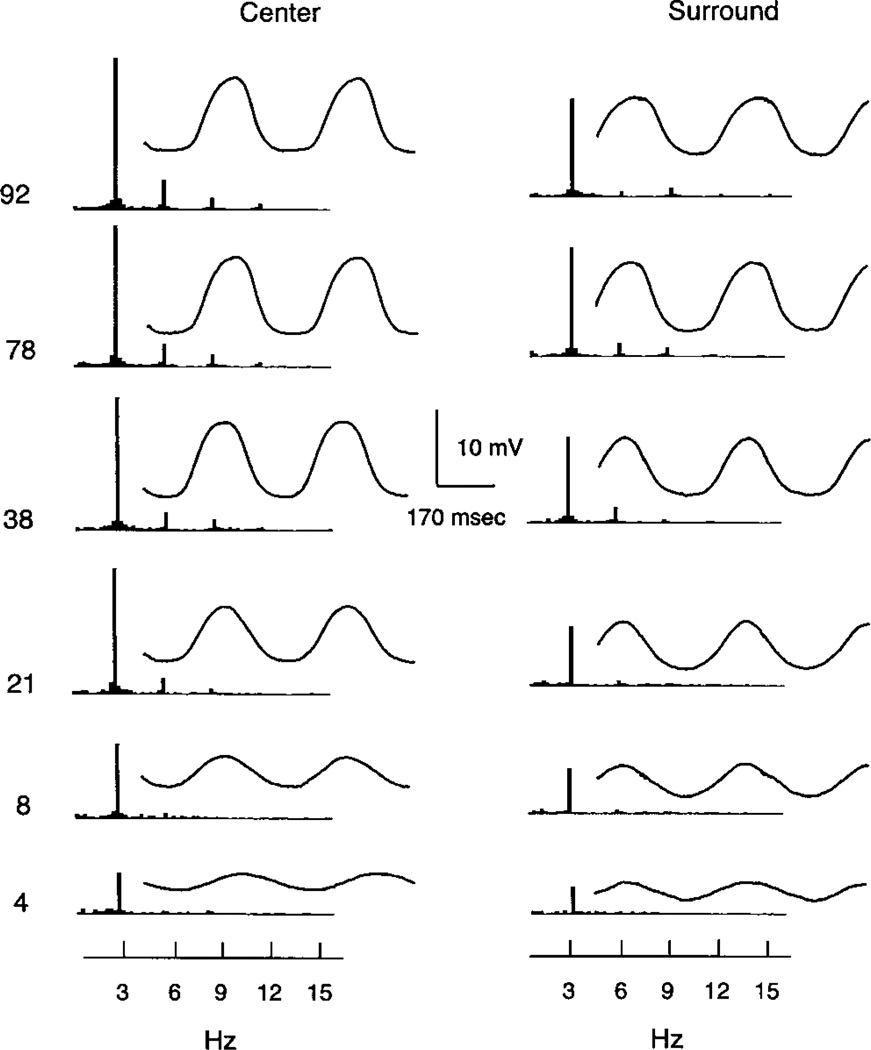
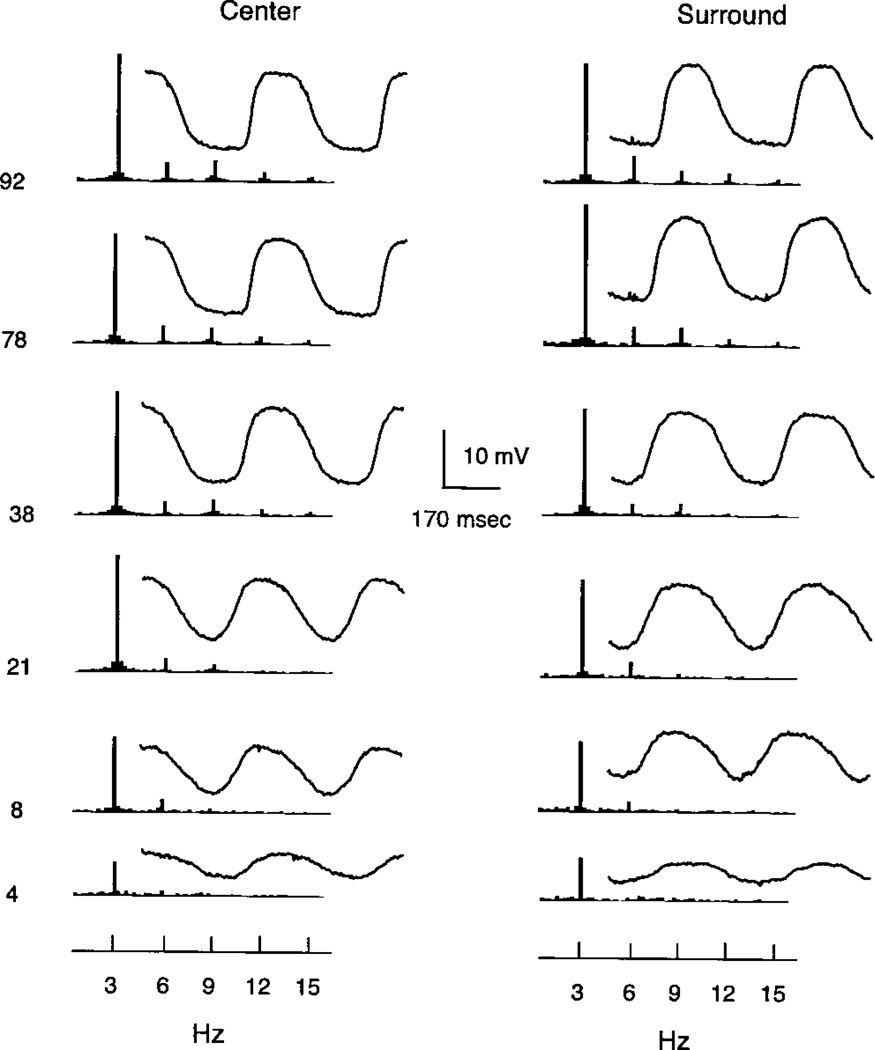
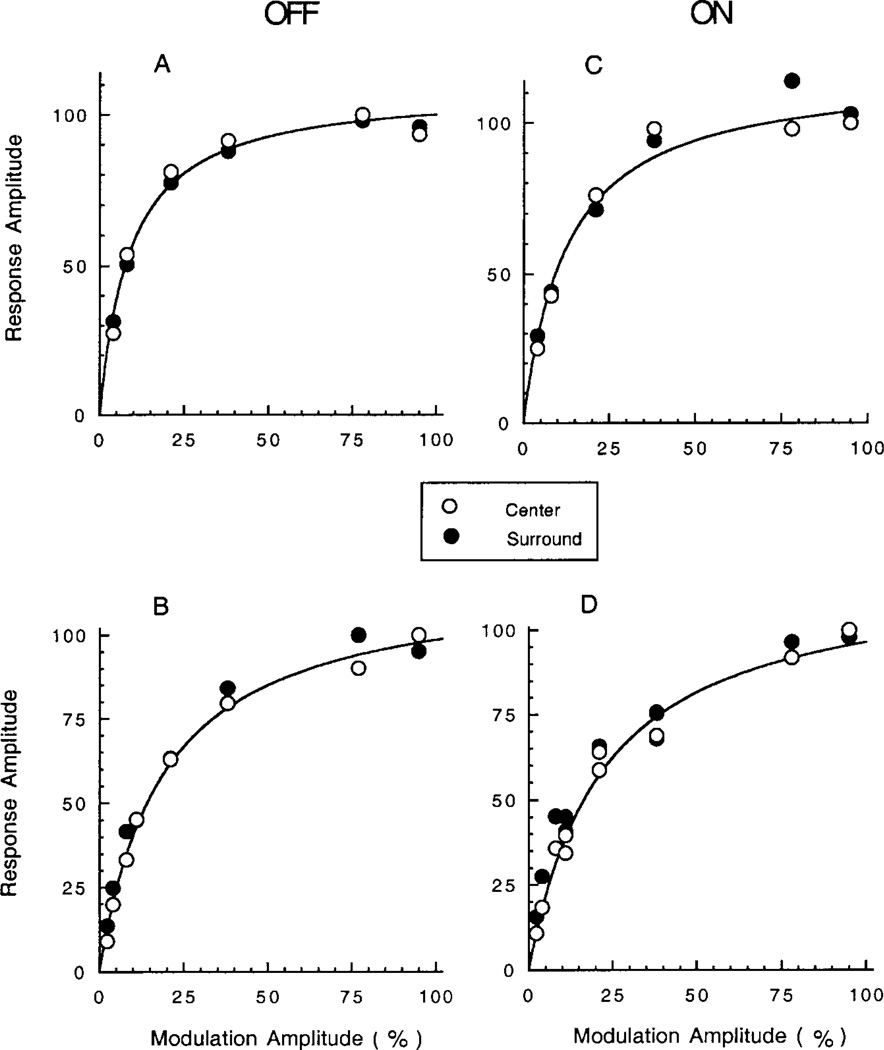
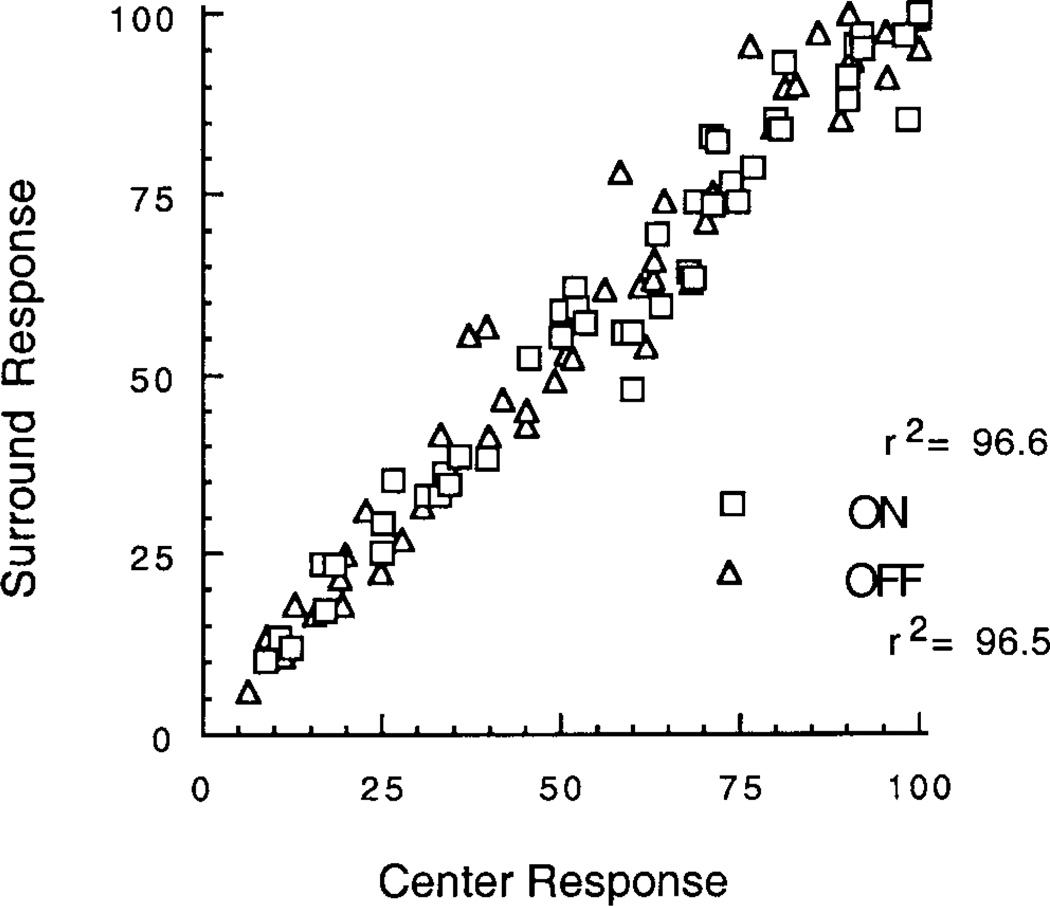
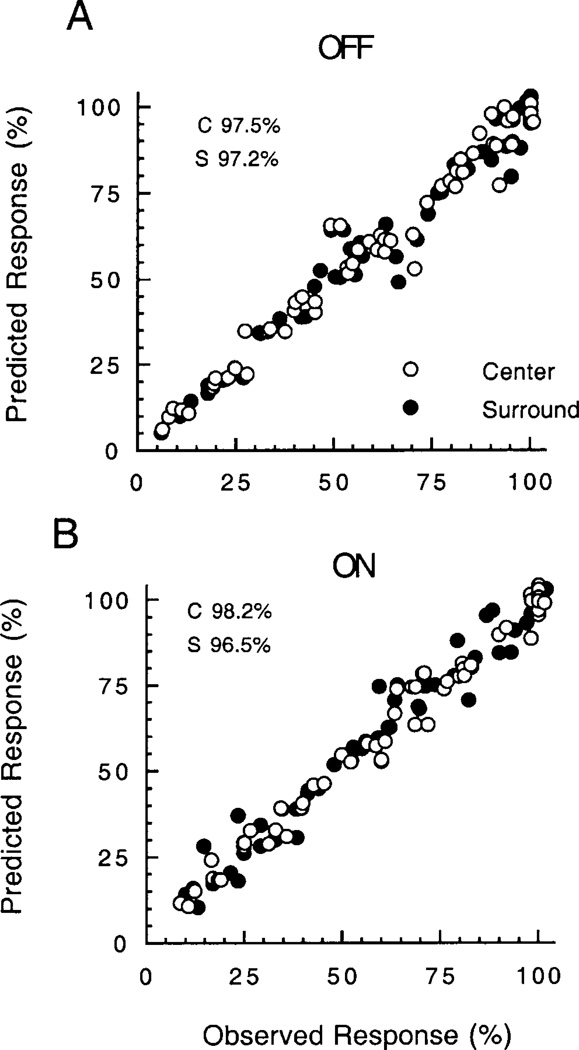
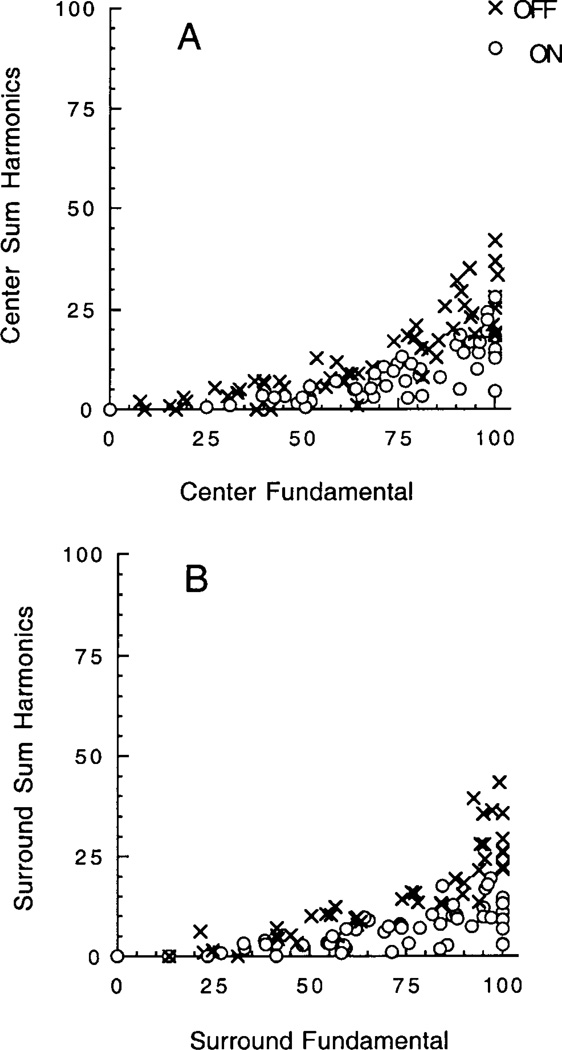
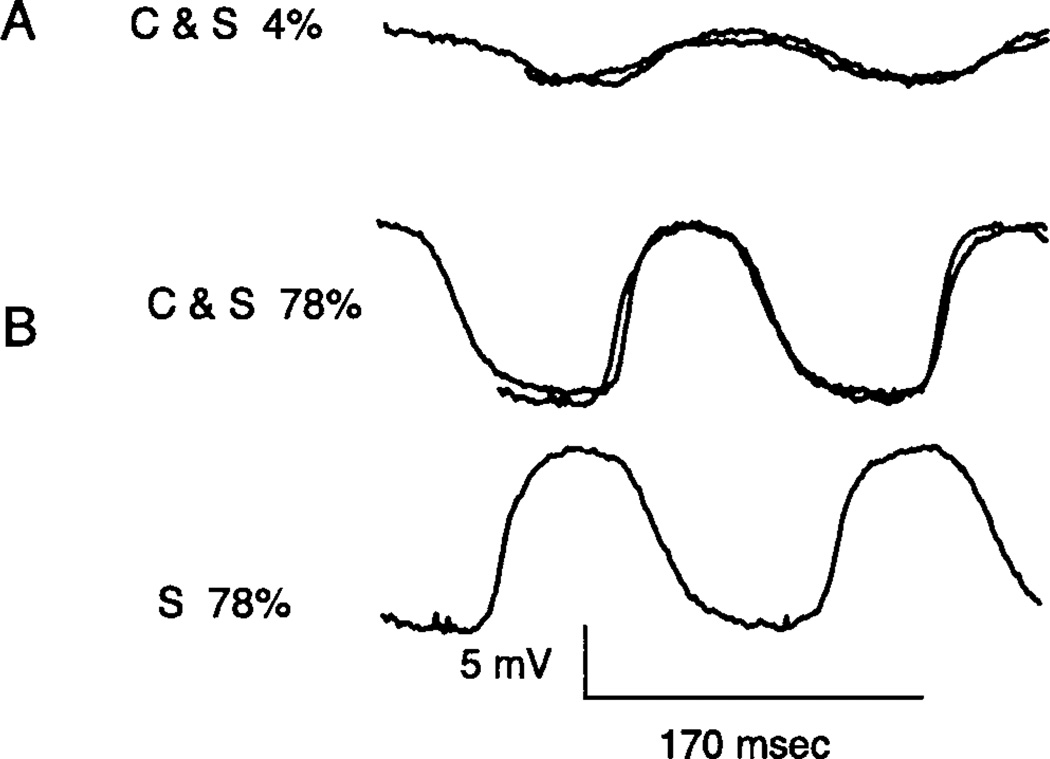
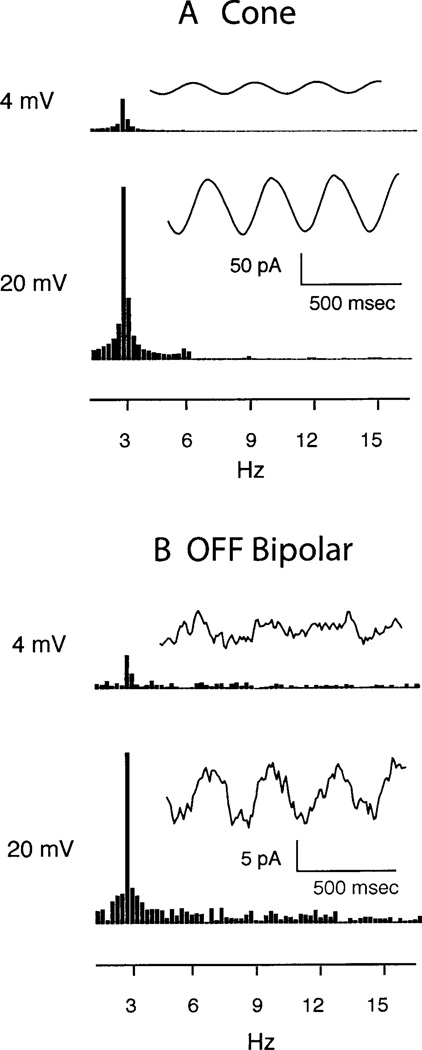
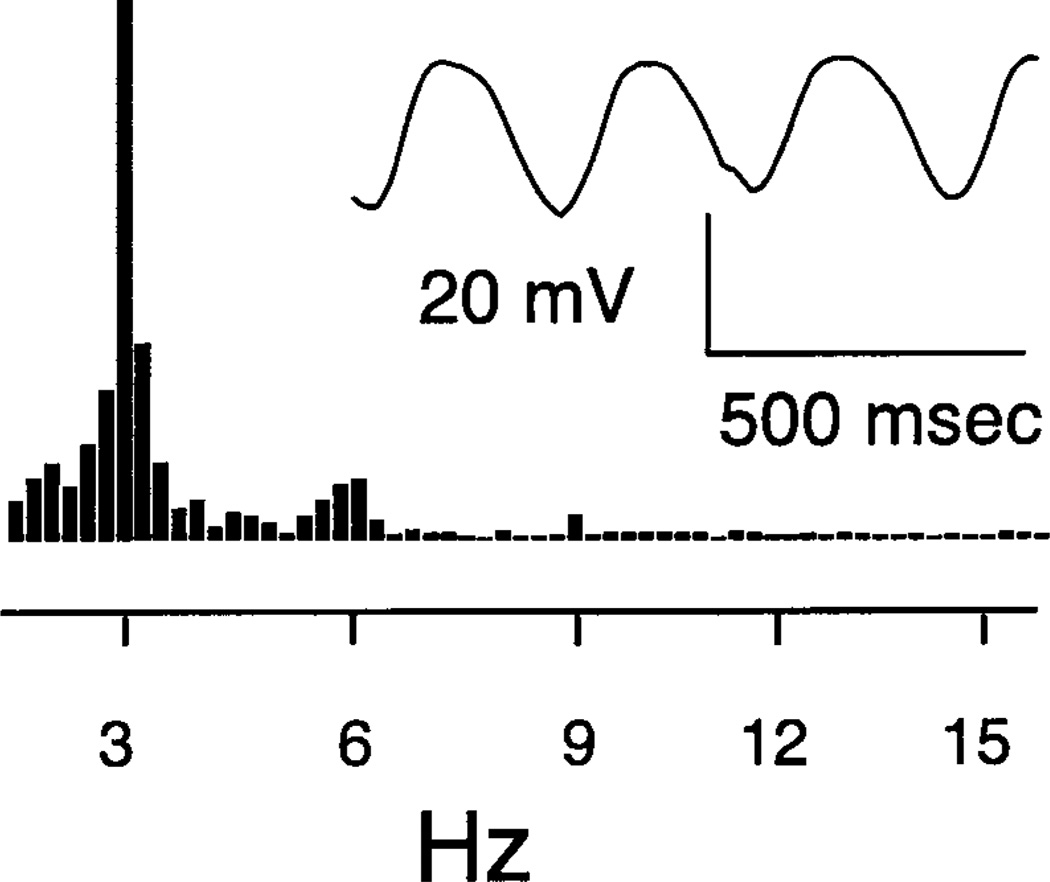
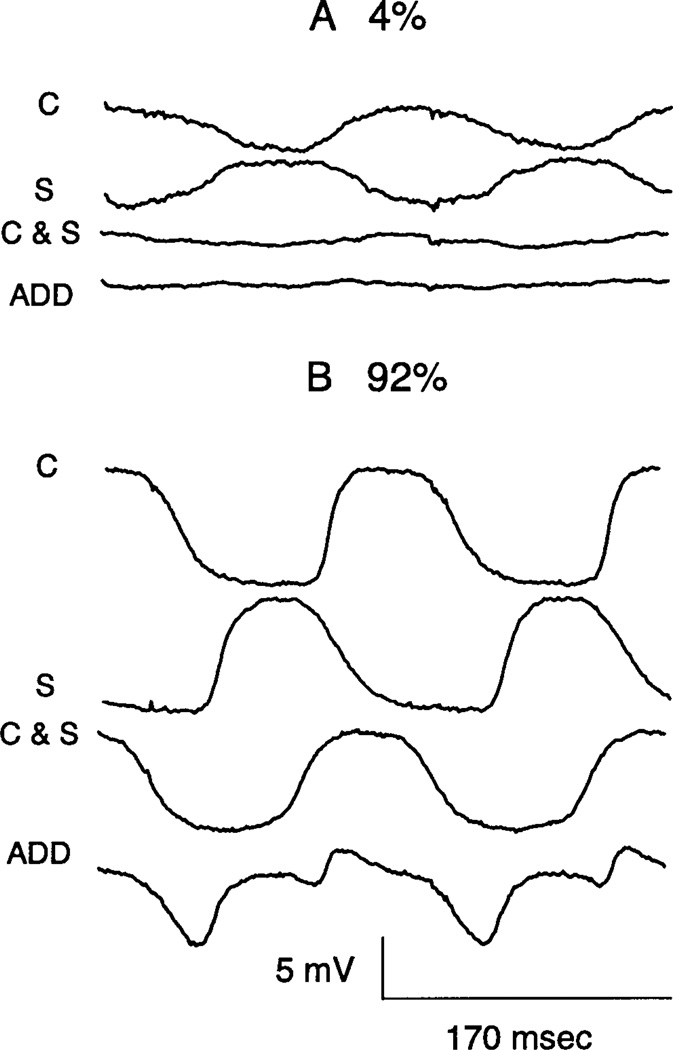
Receptive field organization of cone-driven bipolar cells was investigated by intracellular recording in the intact light-adapted retina of the tiger salamander (Ambystoma tigrinum). Centered spots and concentric annuli of optimum dimensions were used to selectively stimulate the receptive field center and surround with sinusoidal modulations of contrast at 3 Hz. At low contrasts, responses of both the center and surround of both ON and OFF bipolar cells were linear, showing high gain and thus contrast enhancement relative to cones. The contrast/response curves for the fundamental response, measured by a Fast Fourier Transform, reached half maximum amplitude quickly at 13% contrast followed by saturation at high contrasts. The variation of the normalized amplitude of the center and surround responses was remarkably similar, showing linear regression over the entire response range with very high correlations, r2 = 0.97 for both ON and OFF cells. The contrast/response curves of both center and surround for both ON and OFF cells were well fit (r2 = 0.98) by an equation for single-site binding. In about half the cells studied, the nonlinear waveforms of center and surround could be brought into coincidence by scaling and shifting the surround response in time. This implies that a nonlinearity, common to both center and surround, occurs after polarity inversion at the cone feedback synapse. Evidence from paired whole-cell recordings between single cones and OFF bipolar cells suggests that substantial nonlinearity is not due to transmission at the cone synapse but instead arises from intrinsic bipolar cell and network mechanisms. When sinusoidal contrast modulations were applied to the center and surround simultaneously, clear additivity was observed for small responses in both ON and OFF cells, whereas the interaction was strikingly nonadditive for large responses. The contribution of the surround was then greatly reduced, suggesting attenuation at the cone feedback synapse.
Figures
Similar articles
-
Center-surround organization in bipolar cells: symmetry for opposing contrasts.Vis Neurosci. 2003 Jan-Feb;20(1):1-10. doi: 10.1017/s0952523803201012. Vis Neurosci. 2003. PMID: 12699078
-
Natural images and contrast encoding in bipolar cells in the retina of the land- and aquatic-phase tiger salamander.Vis Neurosci. 2006 Jan-Feb;23(1):35-47. doi: 10.1017/S0952523806231043. Vis Neurosci. 2006. PMID: 16597349
-
Retinal bipolar cells: contrast encoding for sinusoidal modulation and steps of luminance contrast.Vis Neurosci. 2004 Nov-Dec;21(6):883-93. doi: 10.1017/S095252380421608X. Vis Neurosci. 2004. PMID: 15733343
-
Contrast processing by ON and OFF bipolar cells.Vis Neurosci. 2011 Jan;28(1):69-75. doi: 10.1017/S0952523810000313. Epub 2010 Nov 19. Vis Neurosci. 2011. PMID: 21092350 Review.
-
Bipolar Cell Pathways in the Vertebrate Retina.2007 May 24 [updated 2012 Jan 20]. In: Kolb H, Fernandez E, Jones B, Nelson R, editors. Webvision: The Organization of the Retina and Visual System [Internet]. Salt Lake City (UT): University of Utah Health Sciences Center; 1995–. 2007 May 24 [updated 2012 Jan 20]. In: Kolb H, Fernandez E, Jones B, Nelson R, editors. Webvision: The Organization of the Retina and Visual System [Internet]. Salt Lake City (UT): University of Utah Health Sciences Center; 1995–. PMID: 21413382 Free Books & Documents. Review.
Cited by
-
Horizontal-cell like Dm9 neurons in Drosophila modulate photoreceptor output to supply multiple functions in early visual processing.Front Mol Neurosci. 2024 May 15;17:1347540. doi: 10.3389/fnmol.2024.1347540. eCollection 2024. Front Mol Neurosci. 2024. PMID: 38813436 Free PMC article.
-
Antagonistic surround responses in different cones are mediated by feedback synapses from different horizontal cells.Vision Res. 2021 Sep;186:13-22. doi: 10.1016/j.visres.2021.03.013. Epub 2021 May 15. Vision Res. 2021. PMID: 34004350 Free PMC article.
-
Lateral interactions in the outer retina.Prog Retin Eye Res. 2012 Sep;31(5):407-41. doi: 10.1016/j.preteyeres.2012.04.003. Epub 2012 May 3. Prog Retin Eye Res. 2012. PMID: 22580106 Free PMC article. Review.
-
Classical center-surround receptive fields facilitate novel object detection in retinal bipolar cells.Nat Commun. 2022 Sep 26;13(1):5575. doi: 10.1038/s41467-022-32761-8. Nat Commun. 2022. PMID: 36163249 Free PMC article.
-
Nonlinear spatial integration in retinal bipolar cells shapes the encoding of artificial and natural stimuli.Neuron. 2021 May 19;109(10):1692-1706.e8. doi: 10.1016/j.neuron.2021.03.015. Epub 2021 Apr 1. Neuron. 2021. PMID: 33798407 Free PMC article.
References
-
- Baccus SA, Meister M. Fast and slow contrast adaptation in retinal circuitry. Neuron. 2002;36:909–919. - PubMed
-
- Burkhardt DA. Contrast processing by ONand OFF bipolar cells. Visual Neuroscience. 2010;28:69–75. - PubMed
-
- Burkhardt DA, Fahey PK. Contrast enhancement and distributed encoding by bipolar cells in the retina. Journal of Neurophysiology. 1998;80:1070–1081. - PubMed
Publication types
MeSH terms
Grants and funding
LinkOut - more resources
Full Text Sources
Miscellaneous
