

Radiation response and regulation of apoptosis induced by a combination of TRAIL and CHX in cells lacking mitochondrial DNA: a role for NF-κB-STAT3-directed gene expression
- PMID: 21440540
- PMCID: PMC3725824
- DOI: 10.1016/j.yexcr.2011.03.012
Radiation response and regulation of apoptosis induced by a combination of TRAIL and CHX in cells lacking mitochondrial DNA: a role for NF-κB-STAT3-directed gene expression
Erratum in
-
Corrigendum to "Radiation response and regulation of apoptosis induced by a combination of TRAIL and CHX in cells lacking mitochondrial DNA: A role for NF-κB-STAT3-directed gene expression" [Exp. Cell Res. 317 (2011) 1548-1566].Exp Cell Res. 2021 Sep 15;406(2):112776. doi: 10.1016/j.yexcr.2021.112776. Epub 2021 Aug 13. Exp Cell Res. 2021. PMID: 34399973 Free PMC article. No abstract available.
Abstract
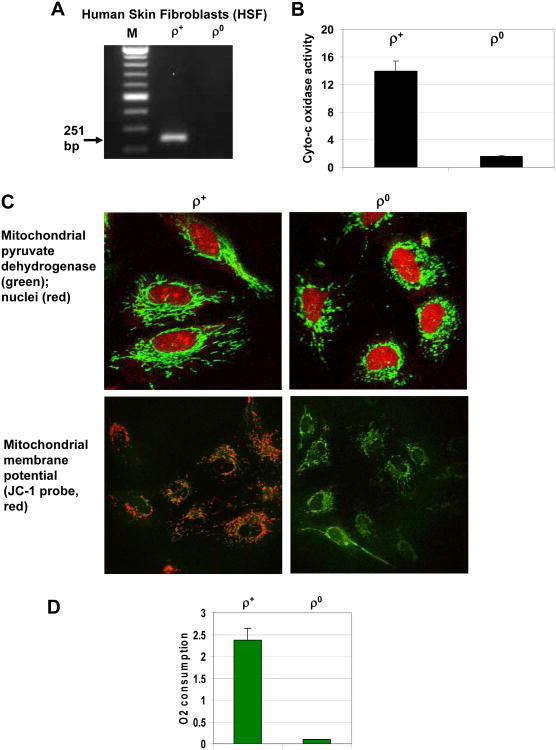
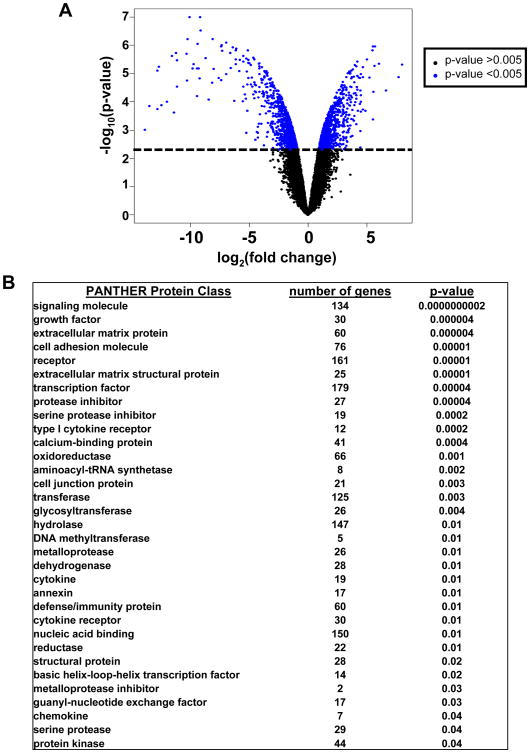
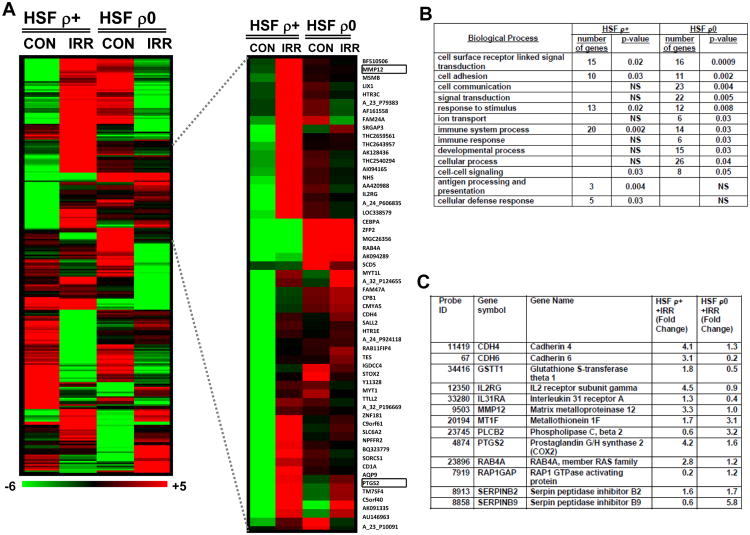
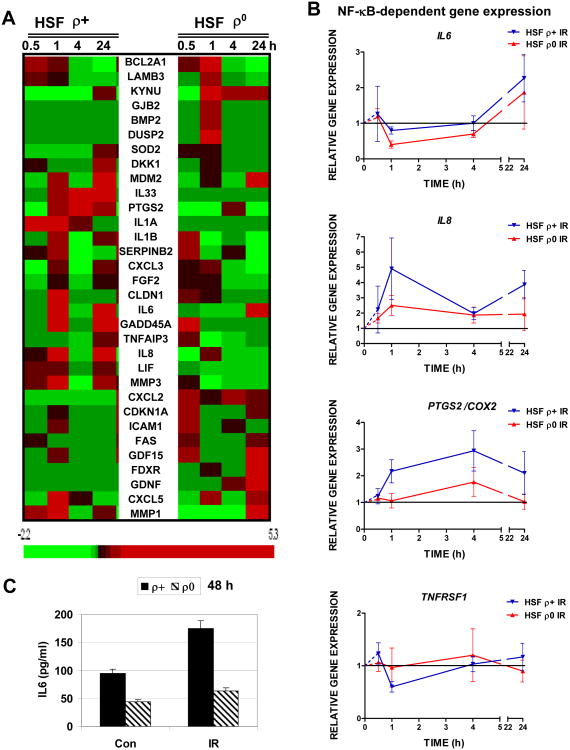
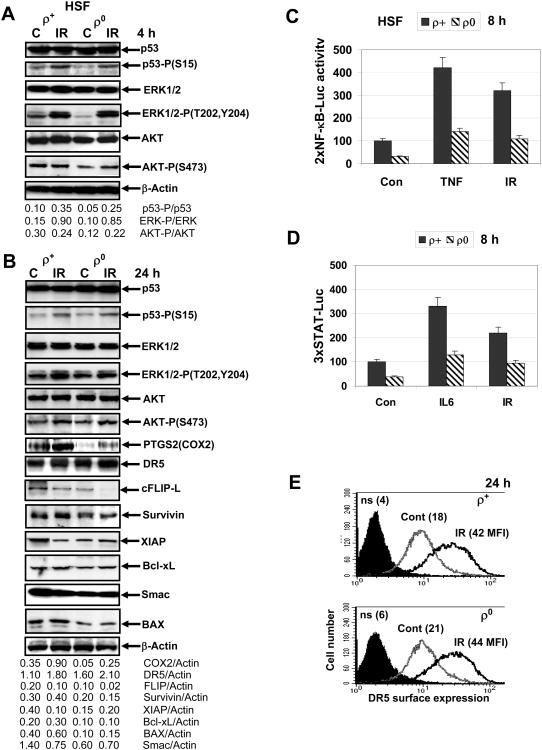
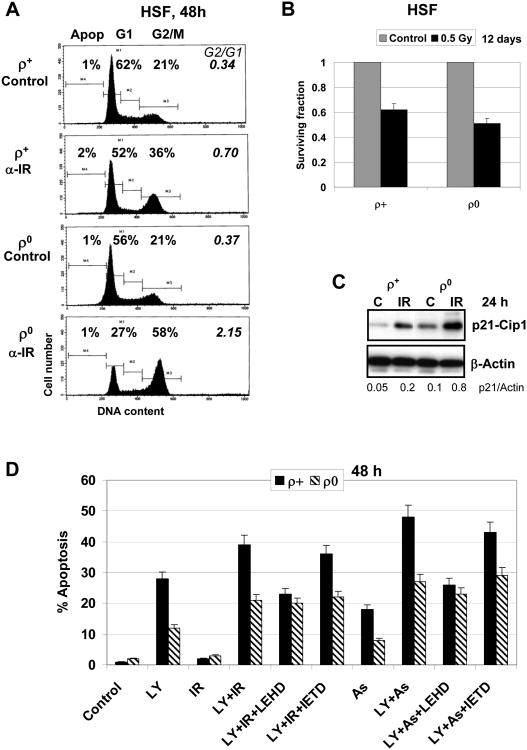
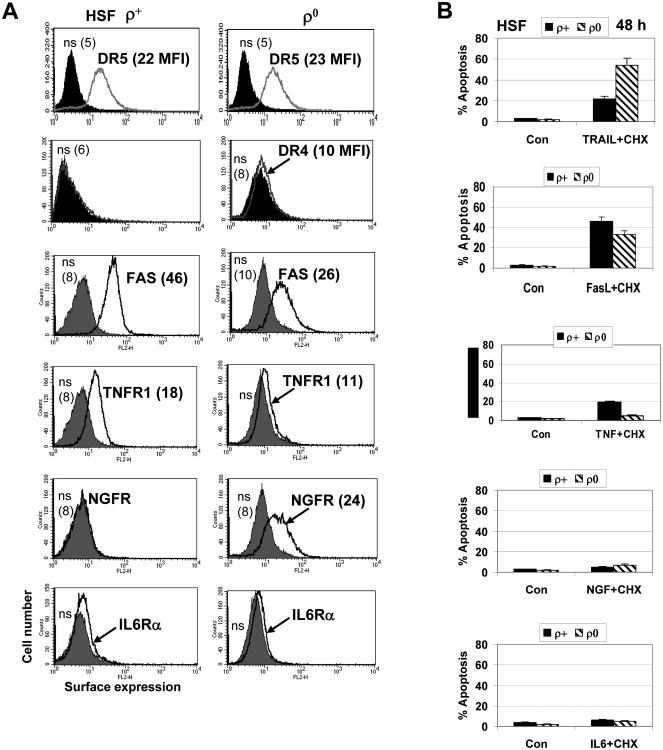
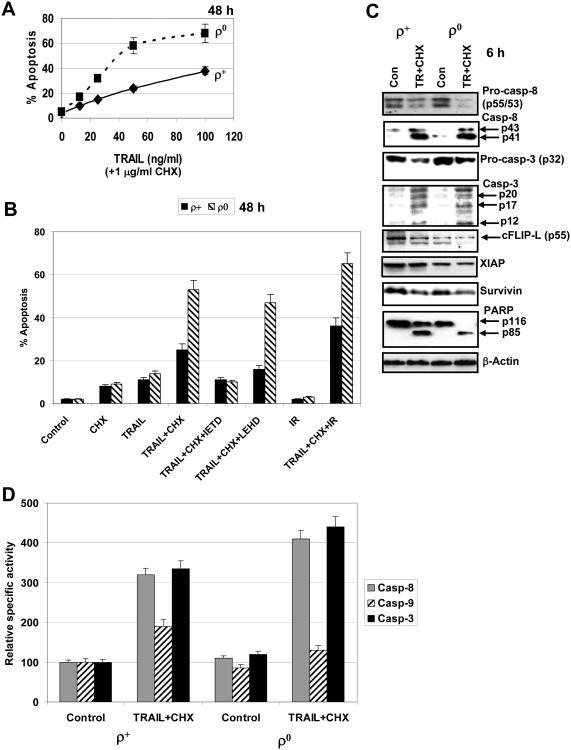
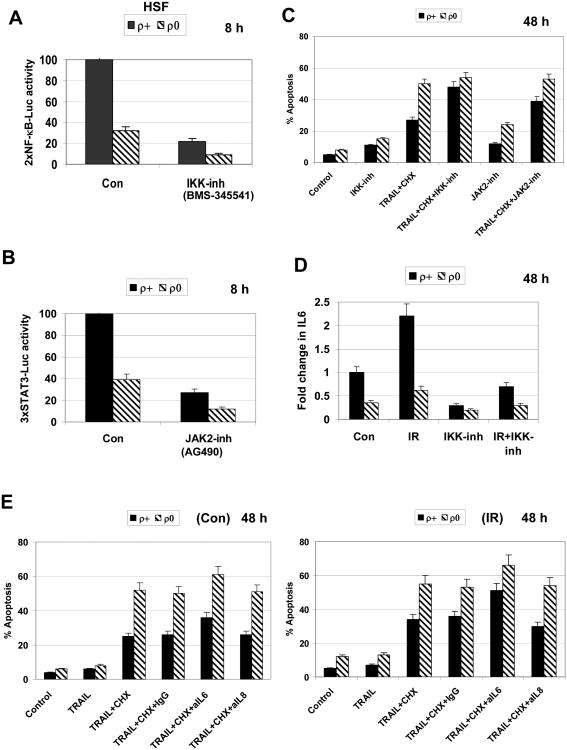
Mitochondrial DNA depleted (ρ(0)) human skin fibroblasts (HSF) with suppressed oxidative phosphorylation were characterized by significant changes in the expression of 2100 nuclear genes, encoding numerous protein classes, in NF-κB and STAT3 signaling pathways, and by decreased activity of mitochondrial death pathway, compared to the parental ρ(+) HSF. In contrast, the extrinsic TRAIL/TRAIL-Receptor mediated death pathway remained highly active, and exogenous TRAIL in a combination with cycloheximide (CHX) induced higher levels of apoptosis in ρ(0) cells compared to ρ(+) HSF. Global gene expression analysis using microarray and qRT-PCR demonstrated that mRNA expression levels of many growth factors and their adaptor proteins (FGF13, HGF, IGFBP4, IGFBP6, and IGFL2), cytokines (IL6, ΙL17Β, ΙL18, ΙL19, and ΙL28Β) and cytokine receptors (IL1R1, IL21R, and IL31RA) were substantially decreased after mitochondrial DNA depletion. Some of these genes were targets of NF-κB and STAT3, and their protein products could regulate the STAT3 signaling pathway. Alpha-irradiation further induced expression of several NF-κB/STAT3 target genes, including IL1A, IL1B, IL6, PTGS2/COX2 and MMP12, in ρ(+) HSF, but this response was substantially decreased in ρ(0) HSF. Suppression of the IKK-NF-κB pathway by the small molecular inhibitor BMS-345541 and of the JAK2-STAT3 pathway by AG490 dramatically increased TRAIL-induced apoptosis in the control and irradiated ρ(+) HSF. Inhibitory antibodies against IL6, the main activator of JAK2-STAT3 pathway, added into the cell media, also increased TRAIL-induced apoptosis in HSF, especially after alpha-irradiation. Collectively, our results indicated that NF-κB activation was partially lost in ρ(0) HSF resulting in downregulation of the basal or radiation-induced expression of numerous NF-κB targets, further suppressing IL6-JAK2-STAT3 that in concert with NF-κB regulated protection against TRAIL-induced apoptosis.
Copyright © 2011 Elsevier Inc. All rights reserved.
Figures
Similar articles
-
Suppression of the proinflammatory response of metastatic melanoma cells increases TRAIL-induced apoptosis.J Cell Biochem. 2011 Feb;112(2):463-75. doi: 10.1002/jcb.22934. J Cell Biochem. 2011. PMID: 21268068 Free PMC article.
-
Inhibition of ataxia telangiectasia mutated kinase activity enhances TRAIL-mediated apoptosis in human melanoma cells.Cancer Res. 2009 Apr 15;69(8):3510-9. doi: 10.1158/0008-5472.CAN-08-3883. Epub 2009 Apr 7. Cancer Res. 2009. PMID: 19351839 Free PMC article.
-
NF-kappaB-independent actions of sulfasalazine dissociate the CD95L- and Apo2L/TRAIL-dependent death signaling pathways in human malignant glioma cells.Cell Death Differ. 2003 Sep;10(9):1078-89. doi: 10.1038/sj.cdd.4401269. Cell Death Differ. 2003. PMID: 12934082
-
Dangerous liaisons: STAT3 and NF-kappaB collaboration and crosstalk in cancer.Cytokine Growth Factor Rev. 2010 Feb;21(1):11-9. doi: 10.1016/j.cytogfr.2009.11.005. Epub 2009 Dec 16. Cytokine Growth Factor Rev. 2010. PMID: 20018552 Free PMC article. Review.
-
NF-κB and STAT3 signaling pathways collaboratively link inflammation to cancer.Protein Cell. 2013 Mar;4(3):176-85. doi: 10.1007/s13238-013-2084-3. Epub 2013 Mar 13. Protein Cell. 2013. PMID: 23483479 Free PMC article. Review.
Cited by
-
X-ray-induced changes in the expression of inflammation-related genes in human peripheral blood.Int J Mol Sci. 2014 Oct 27;15(11):19516-34. doi: 10.3390/ijms151119516. Int J Mol Sci. 2014. PMID: 25350114 Free PMC article.
-
Mitochondria regulate DNA damage and genomic instability induced by high LET radiation.Life Sci Space Res (Amst). 2014 Apr 1;1:80-88. doi: 10.1016/j.lssr.2014.02.006. Life Sci Space Res (Amst). 2014. PMID: 25072018 Free PMC article.
-
Synthetic mRNA-based gene therapy for glioblastoma: TRAIL-mRNA synergistically enhances PTEN-mRNA-based therapy.Mol Ther Oncolytics. 2022 Feb 2;24:707-718. doi: 10.1016/j.omto.2022.01.013. eCollection 2022 Mar 17. Mol Ther Oncolytics. 2022. PMID: 35317516 Free PMC article.
-
A role for TRAIL/TRAIL-R2 in radiation-induced apoptosis and radiation-induced bystander response of human neural stem cells.Apoptosis. 2014 Mar;19(3):399-413. doi: 10.1007/s10495-013-0925-4. Apoptosis. 2014. PMID: 24158598 Free PMC article.
-
Reactive oxygen species mediate Jak2/Stat3 activation and IL-8 expression in pulmonary epithelial cells stimulated with lipid-associated membrane proteins from Mycoplasma pneumoniae.Inflamm Res. 2012 May;61(5):493-501. doi: 10.1007/s00011-012-0437-7. Epub 2012 Jan 24. Inflamm Res. 2012. PMID: 22270622
References
-
- Ashkenazi A, Holland P, Eckhardt SG. Ligand-based targeting of apoptosis in cancer: the potential of recombinant human apoptosis ligand 2/Tumor necrosis factor-related apoptosis-inducing ligand (rhApo2L/TRAIL) J Clin Oncol. 2008;26:3621–3630. - PubMed
-
- Jin Z, El-Deiry WS. Overview of cell death signaling pathways. Cancer Biol Ther. 2005;4:139–163. - PubMed
-
- Ashkenazi A. Targeting death and decoy receptors of the tumour-necrosis factor superfamily. Nat Rev Cancer. 2002;2:420–430. - PubMed
-
- Fulda S, Debatin KM. Sensitization for tumor necrosis factor-related apoptosis-inducing ligand-induced apoptosis by the chemopreventive agent resveratrol. Cancer Res. 2004;64:337–346. - PubMed
Publication types
MeSH terms
Substances
Grants and funding
LinkOut - more resources
Full Text Sources
Molecular Biology Databases
Research Materials
Miscellaneous
