. 2011 Apr;8(2):026013.
doi: 10.1088/1478-3975/8/2/026013. Epub 2011 Mar 25.

Engineering strategies to recapitulate epithelial morphogenesis within synthetic three-dimensional extracellular matrix with tunable mechanical properties

Affiliations

Engineering strategies to recapitulate epithelial morphogenesis within synthetic three-dimensional extracellular matrix with tunable mechanical properties

Y A Miroshnikova et al. Phys Biol. 2011 Apr.

Abstract

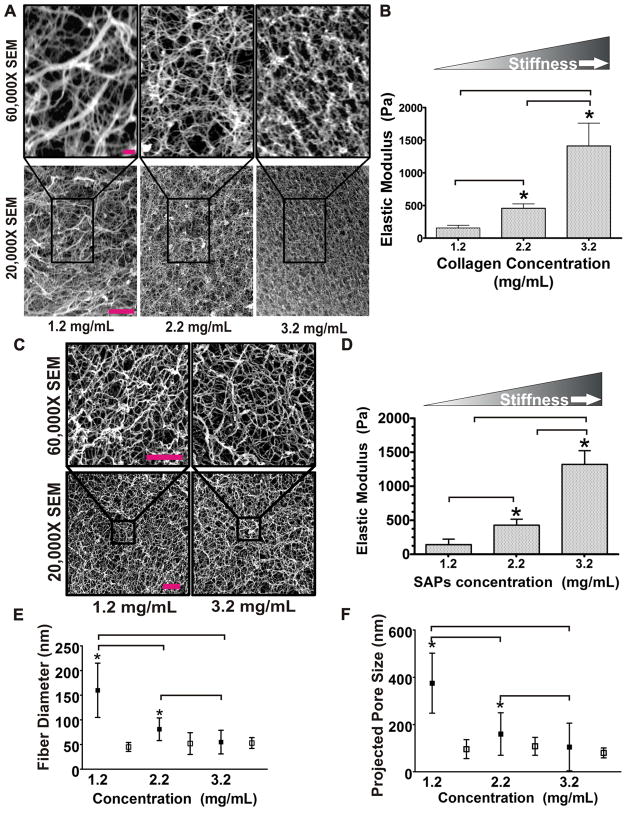
The mechanical properties (e.g. stiffness) of the extracellular matrix (ECM) influence cell fate and tissue morphogenesis and contribute to disease progression. Nevertheless, our understanding of the mechanisms by which ECM rigidity modulates cell behavior and fate remains rudimentary. To address this issue, a number of two and three-dimensional (3D) hydrogel systems have been used to explore the effects of the mechanical properties of the ECM on cell behavior. Unfortunately, many of these systems have limited application because fiber architecture, adhesiveness and/or pore size often change in parallel when gel elasticity is varied. Here we describe the use of ECM-adsorbed, synthetic, self-assembling peptide (SAP) gels that are able to recapitulate normal epithelial acini morphogenesis and gene expression in a 3D context. By exploiting the range of viscoelasticity attainable with these SAP gels, and their ability to recreate native-like ECM fibril topology with minimal variability in ligand density and pore size, we were able to reconstitute normal and tumor-like phenotypes and gene expression patterns in nonmalignant mammary epithelial cells. Accordingly, this SAP hydrogel system presents the first tunable system capable of independently assessing the interplay between ECM stiffness and multi-cellular epithelial phenotype in a 3D context.


Figures

Figure 1
Figure 1. Increasing Collagen Concentration and Rigidity Stimulate Epithelial Growth and Survival and Compromise Tissue Morphogenesis and Integrity
A) (top) Phase contrast images of multi-cellular mammary epithelial cell (MEC) colonies embedded within type 1 collagen gels of increasing concentration (1.2–3.2 mg/mL) and stiffness (150–1400 Pa) for 12 days. Bar equals 30 μm. (bottom) Laser confocal immunofluorescence images of multi-cellular MEC colonies as above, stained for β1 integrin (red), laminin V (green), and nuclei (DAPI; blue). Bar equals 40 μm. B) Bar graphs showing quantification of luminal clearance measured in colonies shown in A. C) Bar graph showing average colony diameter of colonies shown in A. *indicates p ≤ 0.001. Values shown in B- C represent mean ± SEM of multiple measurements from at least 3 independent experiments.
Figure 2
Figure 2. Self Assembling Peptides (SAP): Flexible, Protein-absorbing, Synthetic Matrix that Mimic Collagen Architecture
A) SEM microscopy images of collagen gels taken at high (top) and low (bottom) magnification illustrating the structural changes induced in collagen morphology, topology and pore size when collagen concentration is increased. Bar equals 5 μm. B) Bar graph quantifying Young’s modulus of collagen gels of varying concentration as measured by shear rheology. C) SEM microscopy images of SAP gels taken at high (top) and low (bottom) magnification illustrating minimal structural changes in gel fiber morphology, topology and pore size when gel concentration is increased. Bar equals 200 nm. SEM resolution is 3–5nm (according to the manufacturer). D) Bar graphs quantifying SAP gel stiffness as a function of gel concentration as measured by shear rheology. E) Graphical depiction of fiber diameter quantified as a function of collagen (filled boxes) and SAP (open boxes) gel concentration. F) Graphical depiction of pore size measured as projected pore size in collagen (filled boxes) and SAP (open boxes) gels as a function of gel concentration. *indicates p ≤ 0.001. Values shown in B and D-F represent mean ± SEM of multiple measurements from at least 3 independent experiments.
Figure 3
Figure 3. SAP Gels Support Epithelial Morphogenesis and Direct Apical-Basal Tissue Polarity
A) (top) Phase contrast images of representative multi-cellular MEC acini following growth within reconstituted basement membrane (rBM, Matrigel), type I collagen gels mixed with 10% rBM, or SAPs containing 100 μg/ml laminin for 20 days. (bottom) Laser confocal immunofluorescence images of cryosections (10 μm) of multi-cellular MEC colonies stained with DAPI to reveal nuclei (blue) showing presence of cleared lumens in acini generated in all gel conditions as described above. Bar equals 25 μm B) Line graphs showing growth curves for mammary colonies grown within rBM (green diamond), type 1 collagen gels mixed with 10% rBM (orange box) and SAPs supplemented either with laminin (red circle) or rBM (blue triangle). C) Bar graphs showing quantification of cleared lumens in mammary acini grown in rBM, type 1 collagen gels mixed with 10% rBM and SAPs supplemented either with laminin or rBM (differences in the diameters were not statistically significant). D) Laser confocal immunofluorescence images of cryosections (10 μm) of multi-cellular acini generated in SAPs supplemented with laminin stained with (left image) β4 integrin (green), (middle image) β-catenin (green) and β1 integrin (red) and (right image) fibronectin (green) and β1 integrin. All colonies were counter stained with DAPI (blue) to reveal nuclei. Bar equals 30 μm. Values shown in B and C represent mean ± SEM of multiple measurements from at least 3 independent experiments.
Figure 4
Figure 4. Modulating SAP Stiffness Perturbs Epithelial Morphogenesis, Disrupts Apical-Basal Tissue Polarity, and Alters Gene Expression
A) (left) Phase contrast images of representative multi-cellular MEC acini following growth within rigid SAPs containing 100 μg/ml laminin for 20 days. (right) Laser confocal immunofluorescence image of a cryosection (10 μm) of a multi-cellular MEC colony, generated as described above, stained with DAPI to reveal nuclei (blue) showing absence of cleared lumen in colony generated in a rigid SAP. Note the arrow pointing to the cells migrating into the stiff SAP gel suggestive of invasive behavior. Bar equals 25 μm. B) Bar graphs showing quantification of cleared lumens in mammary acini grown in rBM as compared to MEC colonies assembled in the soft and stiff SAPs supplemented with laminin. Note the high percent of luminal clearance quantified in the acini assembled in either the rBM gels or the compliant SAP gels and a significant reduction of cleared lumens quantified in the colonies generated in the stiff SAP gels. C) Bar graphs quantifying the number of caspase 3 positive lumens in colonies generated in rBM gels versus those assembled within compliant versus stiff SAP gels supplemented with laminin. Data indicate that SAP stiffness represses apoptosis in MECs. D) Bar graphs quantifying the number of Ki67 positive colonies detected in rBM gels versus those assembled within compliant versus stiff SAP gels supplemented with laminin. Data show that SAP stiffness promotes MEC proliferation. D) Laser confocal immunofluorescence showing representative image of cryosections (10 μm) of a multi-cellular MEC colony generated in a stiff SAP supplemented with laminin that was stained with (left) fibronectin (green) and (right) β-catenin (green) and β1 integrin (red) and counter stained with DAPI (blue) to reveal nuclei. Bar equals 30 μm. F) Bar graphs showing the relative expression (by quantitative PCR) of fibronectin 1 and EGFR in acini isolated from soft and stiff laminin-supplemented SAP gels. Values shown in B-D and F represent mean ± SEM of multiple measurements from at least 3 independent experiments.

References

    1. Ingber DE. Mechanical control of tissue morphogenesis during embryological development. Int J Dev Biol. 2006;50(2–3):255–66. - PubMed
    1. Yu H, Mouw JK, Weaver VM. Forcing form and function: biomechanical regulation of tumor evolution. Trends Cell Biol. 2010 - PMC - PubMed
    1. Engler AJ, et al. Matrix elasticity directs stem cell lineage specification. Cell. 2006;126(4):677–89. - PubMed
    1. Engler AJ, et al. Embryonic cardiomyocytes beat best on a matrix with heart-like elasticity: scar-like rigidity inhibits beating. J Cell Sci. 2008;121(Pt 22):3794–802. - PMC - PubMed
    1. Klocke R, et al. Arterial stiffness and central blood pressure, as determined by pulse wave analysis, in rheumatoid arthritis. Ann Rheum Dis. 2003;62(5):414–8. - PMC - PubMed

Publication types