. 2011 May 5;473(7345):43-9.
doi: 10.1038/nature09906. Epub 2011 Mar 23.

Mapping and analysis of chromatin state dynamics in nine human cell types

Affiliations

Mapping and analysis of chromatin state dynamics in nine human cell types

Jason Ernst et al. Nature. .

Abstract

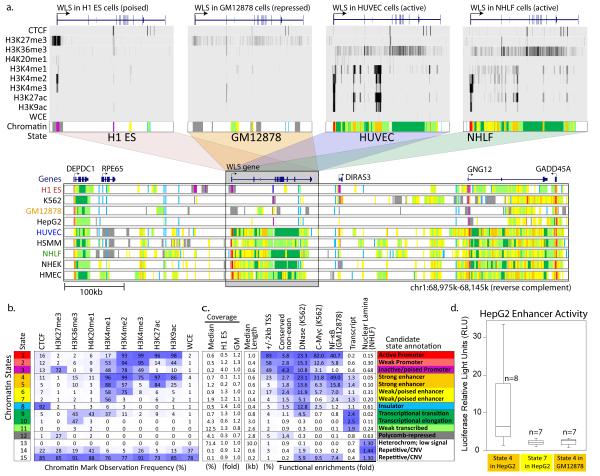
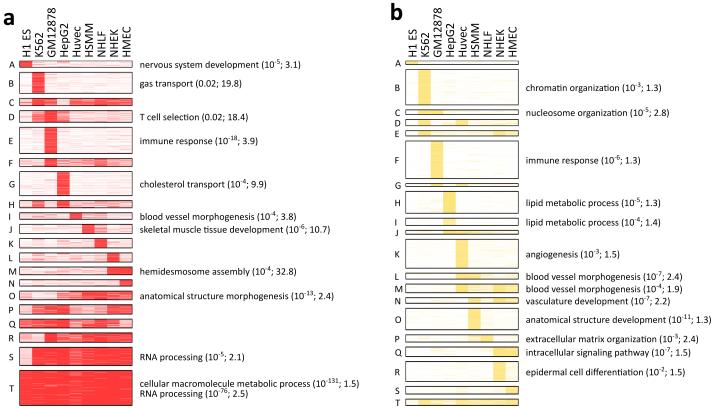
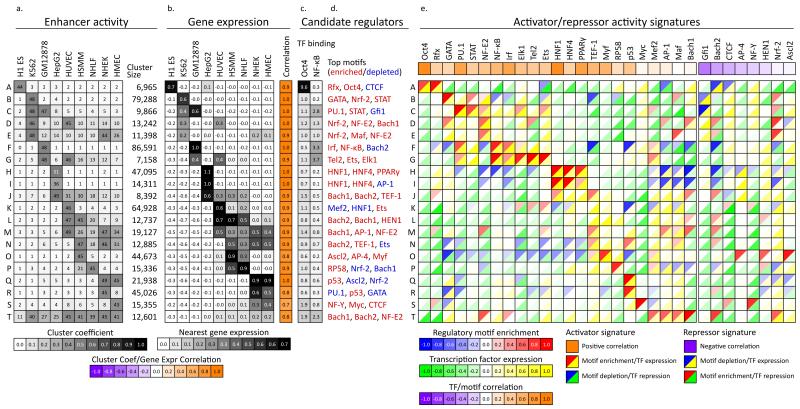
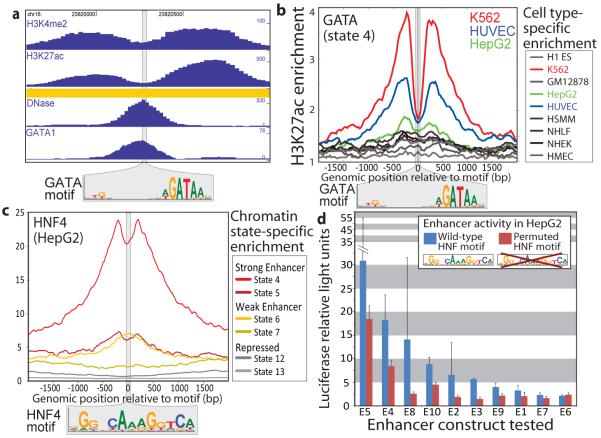
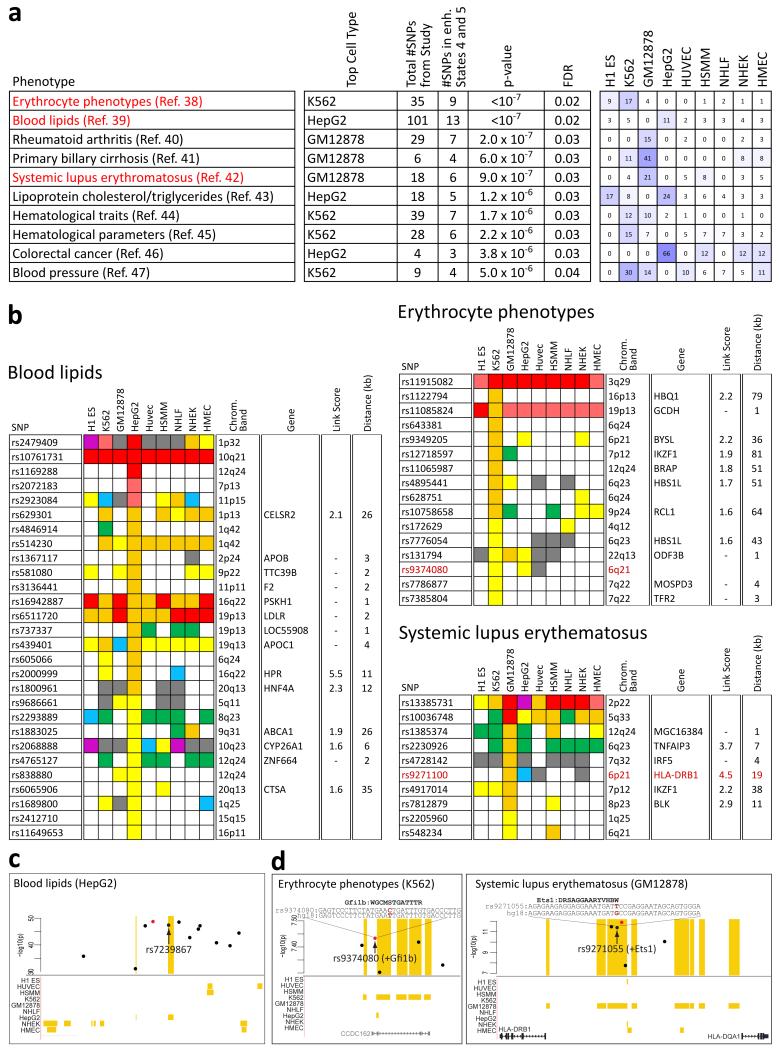
Chromatin profiling has emerged as a powerful means of genome annotation and detection of regulatory activity. The approach is especially well suited to the characterization of non-coding portions of the genome, which critically contribute to cellular phenotypes yet remain largely uncharted. Here we map nine chromatin marks across nine cell types to systematically characterize regulatory elements, their cell-type specificities and their functional interactions. Focusing on cell-type-specific patterns of promoters and enhancers, we define multicell activity profiles for chromatin state, gene expression, regulatory motif enrichment and regulator expression. We use correlations between these profiles to link enhancers to putative target genes, and predict the cell-type-specific activators and repressors that modulate them. The resulting annotations and regulatory predictions have implications for the interpretation of genome-wide association studies. Top-scoring disease single nucleotide polymorphisms are frequently positioned within enhancer elements specifically active in relevant cell types, and in some cases affect a motif instance for a predicted regulator, thus suggesting a mechanism for the association. Our study presents a general framework for deciphering cis-regulatory connections and their roles in disease.


Figures

Figure 1
Figure 1. Chromatin state discovery and characterization
a, Top: Profiles for nine chromatin marks (grayscale) are shown across the wntless (WLS) gene in four cell types, and summarized in a single chromatin state annotation track for each (colored according to b). WLS is poised in ES cells, repressed in GM12878 cells, and transcribed in HUVEC and NHLF. Its TSS switches accordingly between poised (purple), repressed (grey) and active (red) promoter states; enhancer regions within the gene body become strongly activated (orange, yellow); and its gene body changes from low signal (white) to transcribed (green). These chromatin state changes summarize coordinated changes in many chromatin marks; for example, H3K27me3, H3K4me3 and H3K4me2 jointly mark a poised promoter, while loss of H3K27me3 and gain of H3K27ac and H3K9ac mark promoter activation. Bottom: Nine chromatin state tracks, one per cell type, in a 900kb region centered at WLS summarize 90 chromatin tracks in directly-interpretable dynamic annotations, showing activation and repression patterns for 6 genes and hundreds of regulatory regions, including enhancer states. b, Chromatin states learned jointly across cell types by a multivariate HMM. Table shows emission parameters learned de novo based on genome-wide recurrent combinations of chromatin marks. Each entry denotes the frequency with which a given mark is found at genomic positions corresponding to the chromatin state. c, Genome coverage, functional enrichments, and candidate annotations for each chromatin state. Blue shading indicates intensity, scaled by column. d, Box plot depicts enhancer activity for predicted regulatory elements. 250bp-long sequences corresponding to strong or weak/poised HepG2 enhancer elements, or GM12878-specific strong enhancer elements were inserted upstream of a luciferase gene and transfected into HepG2 cells. Reporter activity was measured in relative light units. Robust activity is seen for strong enhancers in the matched cell type, but not for weak/poised enhancers or for strong enhancers specific to a different cell type. Box-and-whiskers indicate 5th, 25th, 50th, 75th and 95th percentiles.
Figure 2
Figure 2. Cell type-specific promoter and enhancer states and associated functional enrichments
a, Clustering of genomic locations (rows) assigned to active promoter state 1 (red) across cell types (columns) reveals 20 common patterns of activity (A-T) (see Methods). For each cluster, enriched gene ontology (GO) terms are shown with hypergeometric P-value and fold-enrichment, based on nearest TSS. For most clusters, several cell types show strong (dark red) or moderate (light red) activity. b, Analogous clustering and functional enrichments for strong enhancer state 4 (yellow). Enhancer states show greater cell type-specificity, with most clusters active in only one cell type.
Figure 3
Figure 3. Correlations in activity patterns link enhancers to gene targets and upstream regulators
a, Average enhancer activity across the cell types (columns) for each enhancer cluster (rows) defined in Figure 2b (labeled A-T) and number of 200bp windows in each cluster. b, Average mRNA expression of nearest gene across the cell types and correlation with enhancer activity profile from a. High correlations between enhancer activity and gene expression provide a means for linking enhancers to target genes. c, Enrichment for Oct4 binding in ES cells and NF-κB binding in lymphoblastoid cells for each cluster. d, Strongly enriched (red) or depleted (blue) motifs for each cluster, from a catalog of 323 consensus motifs. e, Predicted causal regulators for each cluster based on positive (activators) or negative (repressors) correlations between motif enrichment (top left triangles) and TF expression (bottom right triangles). For example, a red/yellow combination predicts Oct4 as a positive regulator of ES-specific enhancers, as its motif-based predicted targets are enriched (red upper triangle) for enhancers active in ES (cluster A), and the Oct4 gene is expressed specifically in ES cells, resulting in a positive TF expression correlation (yellow triangle). Overall correlations between motif and TF expression across all clusters denote predicted activators (positive correlation, orange) and repressors (negative correlation, purple).
Figure 4
Figure 4. Validation of regulatory predictions by nucleosome depletions and enhancer activity
a, Dips in chromatin intensity profiles in a K562-specific strong enhancer (orange) coincide with a predicted causal GATA motif instance (logo). The dips likely reflect nucleosome displacement associated with TF binding, supported by DNase hypersensitivity and GATA1 binding. b, Superposition of H3K27ac signal across loci containing GATA motifs, centered on motif instances, shows dips in K562 cells, as predicted. c, Superposition of H3K4me2 signal for HepG2 cells shows dips over HNF4 motifs in strong enhancer states, as predicted. d, HepG2-specific strong enhancers with predicted causal HNF motifs were tested in reporter assays. Constructs with permuted HNF motifs (red) led to significantly reduced luciferase activity compared to wild type (blue), with an average 2-fold reduction. Mean luciferase relative light units over three replicates and 95% confidence intervals are indicated.
Figure 5
Figure 5. Disease variants annotated by chromatin dynamics and regulatory predictions
a, Intersection of strong enhancer states (4,5) with disease-associated SNPs from GWAS studies shows significant enrichment (blue shading) in relevant cell types (see Methods). Fold-enrichments of the SNPs in strong enhancer states for each cell type are indicated. b, For three GWAS datasets-, state annotations are shown for a subset of lead SNPs in the 9 cell types (colors as in Figure 1b, except state 11 is white). Strong enhancer state (orange) is most prevalent in cell types related to the phenotype. For SNPs overlapping strong enhancers, proximal genes with correlated expression are indicated, with linking score and distance. c, Example GWAS locus with blood lipid traits association, where the lead variant (red circle) has no functional annotation but a linked SNP (arrow) coincides with a HepG2-specific strong enhancer (orange), and may represent a causal variant. Strong enhancer annotations are shown for all cell types. d, Example GWAS loci where disease SNP affects a conserved instance of a predicted causal motif. Left: Lead SNP rs9374080 in the erythrocyte phenotype GWAS is <100 bp from a strong enhancer in K562 erythroleukemia cells and strengthens a motif for Gfi1b, a predicted repressor in K562 (Fig. 3d). Right: SNP rs9271055 associated with lupus coincides with a lymphoblastoid (GM12878)-specific strong enhancer and strengthens a motif for Ets1, a predicted activator of lymphoblastoid enhancers (Fig. 3d). This factor is further implicated by lupus-associated variants that directly affect the Ets1 locus.

Comment in

  • Highlighting enhancers.
    Baker M. Baker M. Nat Methods. 2011 May;8(5):373. doi: 10.1038/nmeth0511-373. Nat Methods. 2011. PMID: 21678620 No abstract available.

Similar articles

Cited by

References

    1. Ludwig TE, et al. Feeder-independent culture of human embryonic stem cells. Nat Methods. 2006;3:637–646. - PubMed
    1. Geiss GK, et al. Direct multiplexed measurement of gene expression with color-coded probe pairs. Nat Biotechnol. 2008;26:317–325. - PubMed
    1. Reich M, et al. GenePattern 2.0. Nat Genet. 2006;38:500–501. - PubMed
    1. Kent WJ, et al. The human genome browser at UCSC. Genome Res. 2002;12:996–1006. - PMC - PubMed
    1. Pruitt KD, Tatusova T, Maglott DR. NCBI reference sequences (RefSeq): a curated non-redundant sequence database of genomes, transcripts and proteins. Nucleic Acids Res. 2007;35:D61–65. - PMC - PubMed

Publication types

Associated data