. 2011 May;14(5):635-41.
doi: 10.1038/nn.2782. Epub 2011 Mar 27.

Single-neuron dynamics in human focal epilepsy

Affiliations

Single-neuron dynamics in human focal epilepsy

Wilson Truccolo et al. Nat Neurosci. 2011 May.

Abstract

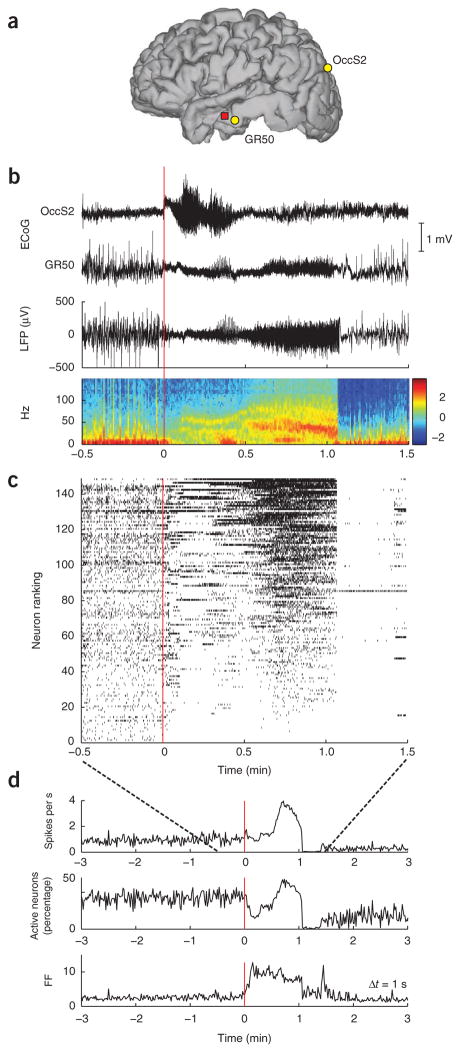
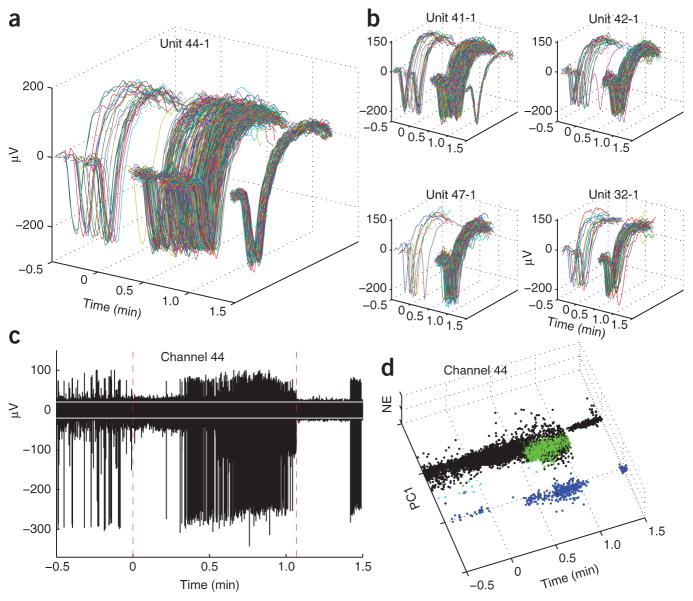
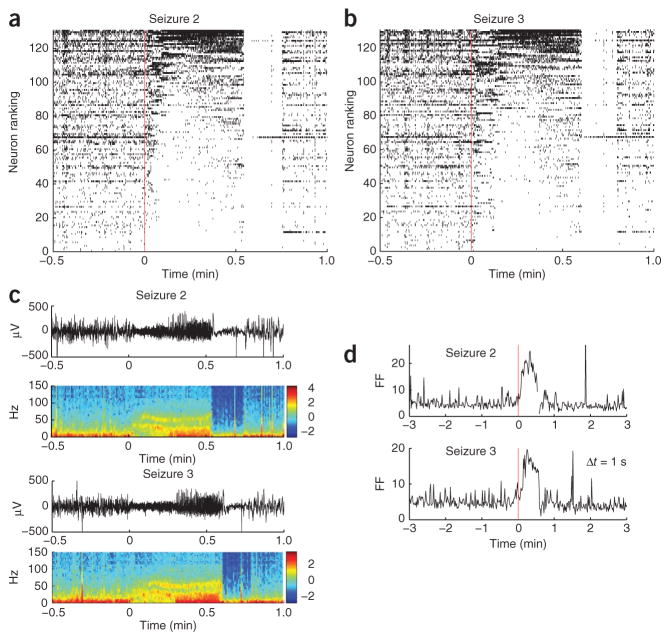
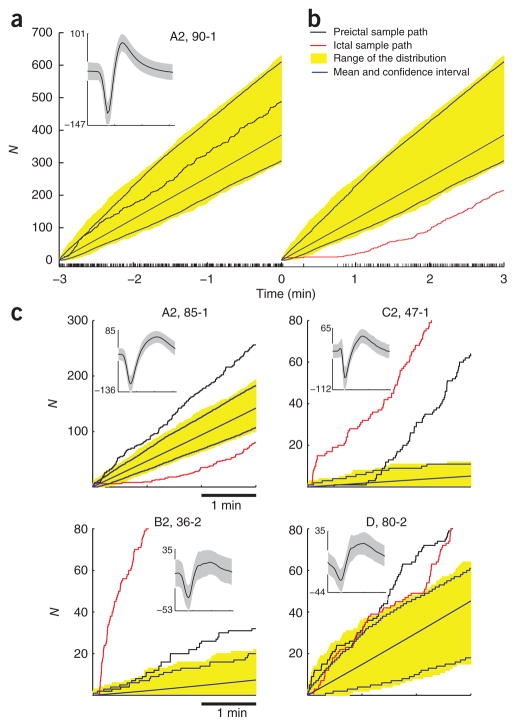
Epileptic seizures are traditionally characterized as the ultimate expression of monolithic, hypersynchronous neuronal activity arising from unbalanced runaway excitation. Here we report the first examination of spike train patterns in large ensembles of single neurons during seizures in persons with epilepsy. Contrary to the traditional view, neuronal spiking activity during seizure initiation and spread was highly heterogeneous, not hypersynchronous, suggesting complex interactions among different neuronal groups even at the spatial scale of small cortical patches. In contrast to earlier stages, seizure termination is a nearly homogenous phenomenon followed by an almost complete cessation of spiking across recorded neuronal ensembles. Notably, even neurons outside the region of seizure onset showed significant changes in activity minutes before the seizure. These findings suggest a revision of current thinking about seizure mechanisms and point to the possibility of seizure prevention based on spiking activity in neocortical neurons.


Conflict of interest statement

COMPETING FINANCIAL INTERESTS

The authors declare competing financial interests: details accompany the full-text HTML version of the paper at http://www.nature.com/natureneuroscience/.

Figures

Figure 1
Figure 1
Heterogeneous neuronal spiking patterns during seizure. (a) Locations of the microelectrode array in participant A (red square), and subdural ECoG electrodes OccS2 and GR50 in occipital and middle temporal cortices, respectively. (b) ECoG traces recorded at the locations shown in a during seizure 1. The ECoG-based onset area was identified to be under the occipital electrode OccS2. Seizure onset is at time 0. The local field potential (LFP) recorded from a single channel in the microelectrode array and the corresponding spectrogram (in dB) are shown below. (c) Neuronal spike raster plot including all recorded neurons (n = 149). Each hash mark represents the occurrence of an action potential. Neurons were ranked (vertical axis) in increasing order according of their mean spiking rate during the seizure. (This ranking number is unrelated to physical location.) Toward the end of the seizure, activity across the population became more homogeneous until spiking was abruptly interrupted at seizure termination. With the exception of a few neurons, spiking in the recorded population remained suppressed for about 20 s. (d) The mean population rate, the percentage of active neurons and the Fano factor (FF) of the spike counts across different neurons at a given time (determined in 1-s time bins). These were roughly stationary during the several minutes preceding the seizure onset. An increase in the Fano factor, reflecting the heterogeneity in neuronal spiking, is observed around seizure onset and precedes an increase in the mean population rate.
Figure 2
Figure 2
Transient suppression of neuronal spiking during the seizure and at seizure termination. (a) Spike waveforms from neuron 44–1 (participant A, seizure 1; neuron ranked no. 131 in Fig. 1c). Spiking stopped for ∼ 20 s during the initial seizure phase. The lack of major changes in spike waveform and preceding low spiking rate suggest that suppression was not due to sorting artifacts or depolarization block. (b) Four examples of units with similar behavior, recorded from different sites. All five units were classified as putative principal cells. (c) The high-pass filtered potentials recorded at electrode 44. Larger spikes correspond to unit 44–1, shown in a. Dashed vertical lines show seizure onset and termination, respectively. White lines mark ±3 s.d. of the background noise, estimated from the ‘silent’ period after seizure termination. Another unit with smaller extracellularly recorded action potentials intensifies spiking during the 0.5–1.1 min interval. After seizure termination, both single-unit and multiunit activity were suppressed and the recorded potentials correspond primarily to background noise. Although there is some gradual decrease in spike amplitudes, this decrease is much smaller than what would be expected from depolarization block. See Supplementary Figure 2 for channels 32, 41, 42 and 47. (d) Projection of thresholded waveforms onto a feature space shows clearly separable units. Blue dots represent thresholded spikes from unit 44–1; PC1 and NE denote the first principal component and a nonlinear energy feature, respectively. Green dots correspond to a smaller unit. Black dots correspond to thresholded noise and unsorted multiunit spikes.
Figure 3
Figure 3
Reproducibility of neuronal spiking modulation patterns across consecutive seizures. (a,b) An example from participant A with 131 neurons. Following conventions used in Figure 1c, neurons are ranked according to their mean rates measured during the seizure. Seizure 3 (b) follows the same ranking as seizure 2 (a); that is, the single units in any given row of seizures 2 and 3 are the same. Most neurons coarsely preserved the types of spiking rate modulation across the two seizures. For example, the lowest-ranked neurons decreased or stopped spiking; and many of the top-ranked neurons presented similar transient increases in spiking rate modulation. As in seizure 1 (Fig. 1), an almost complete suppression of spiking in the neuronal population occurred abruptly at seizure termination. (c) The corresponding low-pass filtered local field potentials (LFPs) and spectrograms (from the same microelectrode array channel shown in Fig. 1; power in dB). (d) The Fano factor for the spike counts (1-s time bins) in the population of recorded neurons showed similar increase during both seizures, reflecting the increased heterogeneity in neuronal spiking across the population.
Figure 4
Figure 4
Preictal and ictal modulations in spiking rates. (a) The neuronal spiking sample path N (neuron 90–1; A2: participant A, seizure 2). The corresponding spike train is shown at the bottom and the inset shows the mean ± 2 s.d. of all recorded spike waveforms. Seizure onset corresponds to time 0. For comparison purposes, the initial value of the sample path is set to 0. The yellow band corresponds to the range of the 3-min-long sample paths observed during a 30-min interictal period preceding the preictal period. Interictal sample paths in this distribution were obtained from an overlapping 3-min-long moving time window, stepped 1 s at a time. Blue curves and surrounding yellow band correspond to the average interictal sample path and the 95% confidence interval, respectively. A sample path was judged to have deviated from the interictal sample paths when it fell outside the range of the collection of interictal sample paths at any given time. (b) Neuron 90–1 transiently stopped spiking for tens of seconds just after the seizure onset. As expected, the sample path during the seizure did deviate from the observed interictal paths. The neuron’s spiking rate gradually recovered and eventually settled at the typical mean rate. (c) Four examples of preictal and ictal sample path deviations, one for each participant. Note that although the preictal and ictal sample paths are plotted along the same axis, they refer to a 3-min period before and after, respectively, the seizure onset.
Figure 5
Figure 5
Preictal and ictal sample path deviations with respect to an interictal period. Each bar indicates the percentage of preictal and ictal sample path deviations in the recorded neuronal population, for each participant and seizure. Sample paths and sample path deviations were defined as in Figure 4.

Comment in

References

    1. Penfield WG, Jasper HH. Epilepsy and the Functional Anatomy of the Human Brain. Little, Brown; Boston: 1954.
    1. Schwartzkroin PA. Basic mechanisms of epileptogenesis. In: Wyllie E, editor. The Treatment of Epilepsy. Lea and Febiger; Philadelphia: 1993. pp. 83–98.
    1. Fisher RS, et al. Epileptic seizures and epilepsy: definitions proposed by the International League Against Epilepsy (ILAE) and the International Bureau for Epilepsy (IBE) Epilepsia. 2005;46:470–472. - PubMed
    1. Jiruska P, et al. High-frequency network activity, global increase in neuronal activity, and synchrony expansion precede epileptic seizures in vitro. J Neurosci. 2010;30:5690–5701. - PMC - PubMed
    1. Pinto DJ, Patrick SL, Huang WC, Connors BW. Initiation, propagation, and termination of epileptiform activity in rodent neocortex in vitro involve distinct mechanisms. J Neurosci. 2005;25:8131–8140. - PMC - PubMed

Publication types

LinkOut - more resources