

Topography of Somatostatin Gene Expression Relative to Molecular Progenitor Domains during Ontogeny of the Mouse Hypothalamus
- PMID: 21441981
- PMCID: PMC3057523
- DOI: 10.3389/fnana.2011.00010
Topography of Somatostatin Gene Expression Relative to Molecular Progenitor Domains during Ontogeny of the Mouse Hypothalamus
Abstract
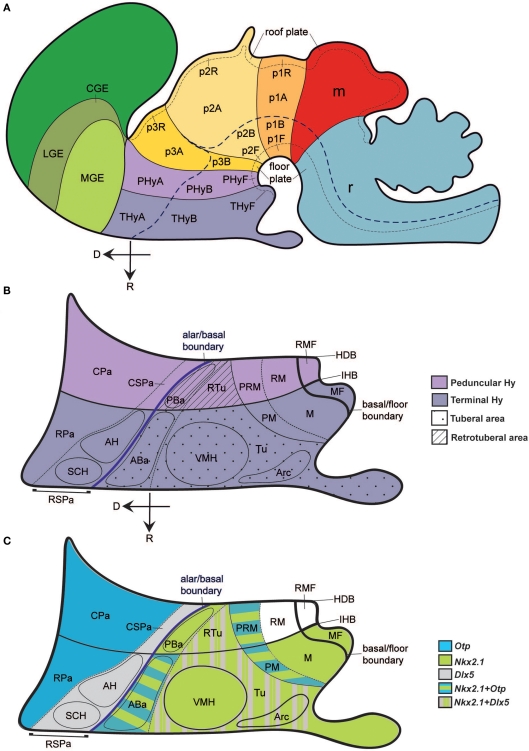
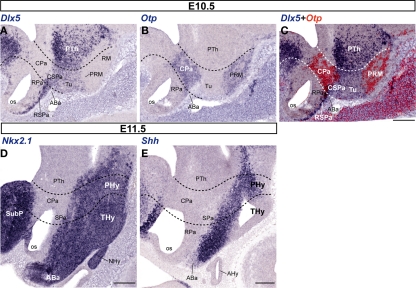
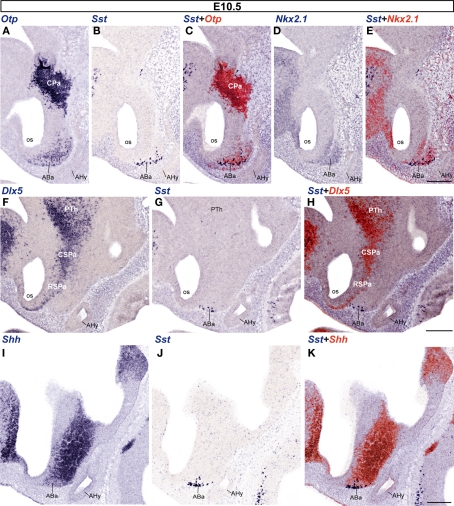
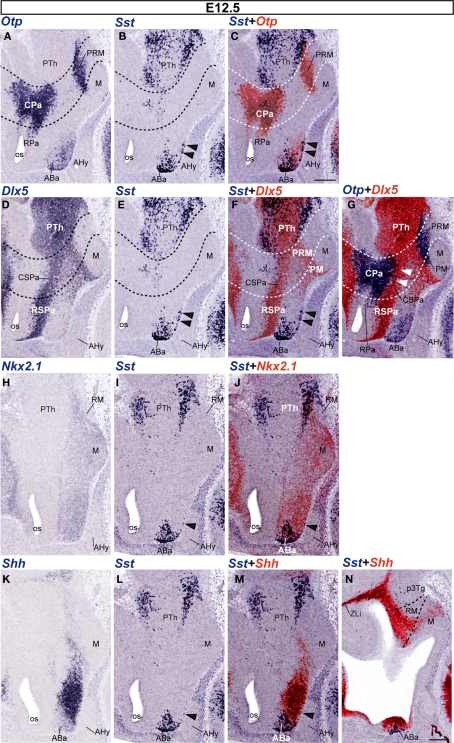
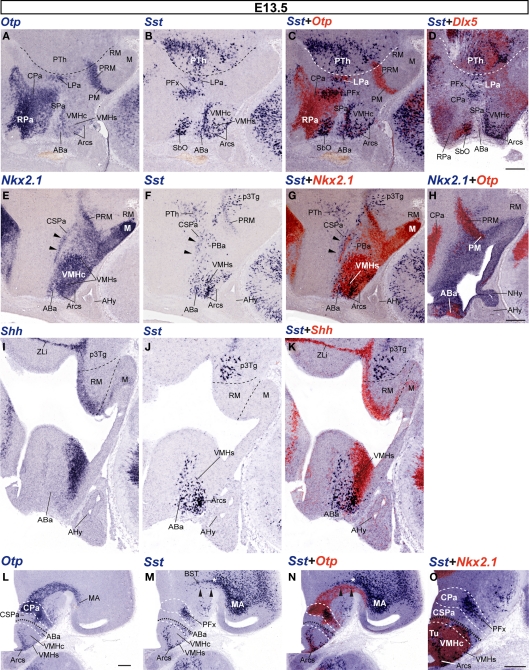
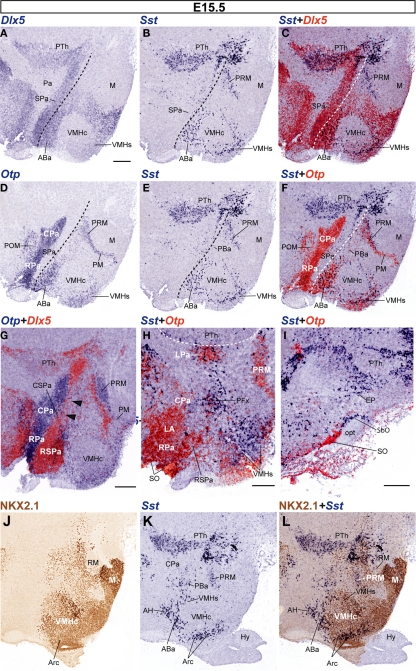
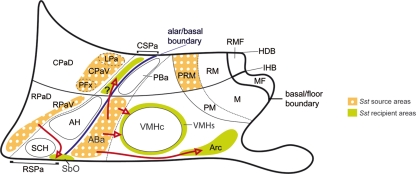
The hypothalamus comprises alar, basal, and floor plate developmental compartments. Recent molecular data support a rostrocaudal subdivision into rostral (terminal) and caudal (peduncular) halves. In this context, the distribution of neuronal populations expressing somatostatin (Sst) mRNA was analyzed in the developing mouse hypothalamus, comparing with the expression pattern of the genes Orthopedia (Otp), Distal-less 5 (Dlx5), Sonic Hedgehog (Shh), and Nk2 homeobox 1 (Nkx2.1). At embryonic day 10.5 (E10.5), Sst mRNA was first detectable in the anterobasal nucleus, a Nkx2.1-, Shh-, and Otp-positive basal domain. By E13.5, nascent Sst expression was also related to two additional Otp-positive domains within the alar plate and one in the basal plate. In the alar plate, Sst-positive cells were observed in rostral and caudal ventral subdomains of the Otp-positive paraventricular complex. An additional basal Sst-expressing cell group was found within a longitudinal Otp-positive periretromamillary band that separates the retromamillary area from tuberal areas. Apart of subsequent growth of these initial populations, at E13.5 and E15.5 some Sst-positive derivatives migrate tangentially into neighboring regions. A subset of cells produced at the anterobasal nucleus disperses ventralward into the shell of the ventromedial hypothalamic nucleus and the arcuate nucleus. Cells from the rostroventral paraventricular subdomain reach the suboptic nucleus, whereas a caudal contingent migrates radially into lateral paraventricular, perifornical, and entopeduncular nuclei. Our data provide a topologic map of molecularly defined progenitor areas originating a specific neuron type during early hypothalamic development. Identification of four main separate sources helps to understand causally its complex adult organization.
Keywords: Dlk5; Nkx2.1; Otp; Shh; Sst; forebrain; hypothalamus; in situ hybridization.
Figures
Similar articles
-
Regionalized differentiation of CRH, TRH, and GHRH peptidergic neurons in the mouse hypothalamus.Brain Struct Funct. 2014 May;219(3):1083-111. doi: 10.1007/s00429-013-0554-2. Epub 2013 Apr 30. Brain Struct Funct. 2014. PMID: 24337236 Free PMC article.
-
Ontogenetic distribution of the transcription factor nkx2.2 in the developing forebrain of Xenopus laevis.Front Neuroanat. 2011 Mar 2;5:11. doi: 10.3389/fnana.2011.00011. eCollection 2011. Front Neuroanat. 2011. PMID: 21415915 Free PMC article.
-
Conserved pattern of OTP-positive cells in the paraventricular nucleus and other hypothalamic sites of tetrapods.Brain Res Bull. 2008 Mar 18;75(2-4):231-5. doi: 10.1016/j.brainresbull.2007.10.037. Epub 2007 Nov 20. Brain Res Bull. 2008. PMID: 18331876
-
Patterns of hypothalamic regionalization in amphibians and reptiles: common traits revealed by a genoarchitectonic approach.Front Neuroanat. 2015 Feb 3;9:3. doi: 10.3389/fnana.2015.00003. eCollection 2015. Front Neuroanat. 2015. PMID: 25691860 Free PMC article. Review.
-
Sonic hedgehog signaling in the development of the mouse hypothalamus.Front Neuroanat. 2015 Jan 6;8:156. doi: 10.3389/fnana.2014.00156. eCollection 2014. Front Neuroanat. 2015. PMID: 25610374 Free PMC article. Review.
Cited by
-
LacZ-reporter mapping of Dlx5/6 expression and genoarchitectural analysis of the postnatal mouse prethalamus.J Comp Neurol. 2021 Feb;529(2):367-420. doi: 10.1002/cne.24952. Epub 2020 Jun 18. J Comp Neurol. 2021. PMID: 32420617 Free PMC article.
-
Sonic hedgehog lineage in the mouse hypothalamus: from progenitor domains to hypothalamic regions.Neural Dev. 2012 Jan 20;7:4. doi: 10.1186/1749-8104-7-4. Neural Dev. 2012. PMID: 22264356 Free PMC article.
-
Developmental genoarchitectonics as a key tool to interpret the mature anatomy of the chondrichthyan hypothalamus according to the prosomeric model.Front Neuroanat. 2022 Aug 4;16:901451. doi: 10.3389/fnana.2022.901451. eCollection 2022. Front Neuroanat. 2022. PMID: 35991967 Free PMC article.
-
Development of catecholaminergic neurons of Otp-lineage in the medial extended amygdala and related forebrain centers.Front Neuroanat. 2025 Mar 19;19:1553952. doi: 10.3389/fnana.2025.1553952. eCollection 2025. Front Neuroanat. 2025. PMID: 40177299 Free PMC article.
-
Prosomeric Hypothalamic Distribution of Tyrosine Hydroxylase Positive Cells in Adolescent Rats.Front Neuroanat. 2022 May 6;16:868345. doi: 10.3389/fnana.2022.868345. eCollection 2022. Front Neuroanat. 2022. PMID: 35601999 Free PMC article.
References
-
- Acampora D., Postiglione M. P., Avantaggiato V., Di Bonito M., Simeone A. (2000). The role of Otx and Otp genes in brain development. Int. J. Dev. Biol. 44, 669–677 - PubMed
-
- Acampora D., Postiglione M. P., Avantaggiato V., Di Bonito M., Vaccarino F. M., Michaud J., Simeone A. (1999). Progressive impairment of developing neuroendocrine cell lineages in the hypothalamus of mice lacking the Orthopedia gene. Genes Dev. 13, 2787–280010.1101/gad.13.21.2787 - DOI - PMC - PubMed
-
- Altman J., Bayer S. A. (1978). Development of the diencephalon in the rat. I. Autoradiographic study of the time of origin and settling patterns of neurons of the hypothalamus. J. Comp. Neurol. 182, 945–971 - PubMed
-
- Altman J., Bayer S. A. (1986). The development of the rat hypothalamus. Adv. Anat. Embryol. Cell Biol. 100, 1–178 - PubMed
-
- Altman J., Bayer S. A. (1995). Atlas of Prenatal Rat Brain Development. Boca Raton: CRC Press
Grants and funding
LinkOut - more resources
Full Text Sources
Molecular Biology Databases
Research Materials