. 2010 Jan 1;3(3):222-233.
doi: 10.1007/s12274-010-1025-1.

Multiplexed Five-Color Molecular Imaging of Cancer Cells and Tumor Tissues with Carbon Nanotube Raman Tags in the Near-Infrared

Affiliations

Multiplexed Five-Color Molecular Imaging of Cancer Cells and Tumor Tissues with Carbon Nanotube Raman Tags in the Near-Infrared

Zhuang Liu et al. Nano Res. .

Abstract

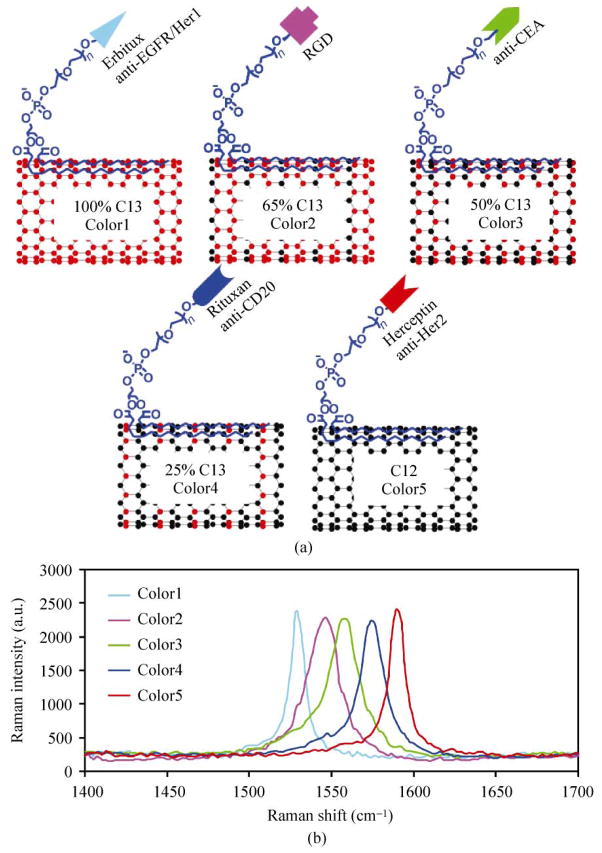
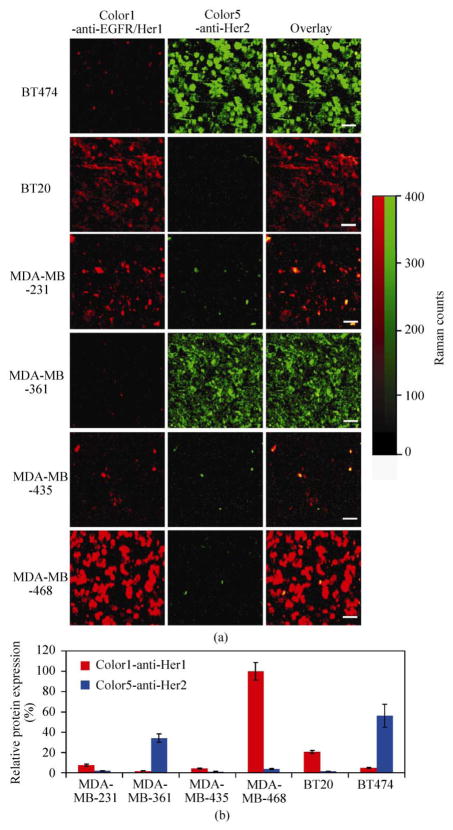
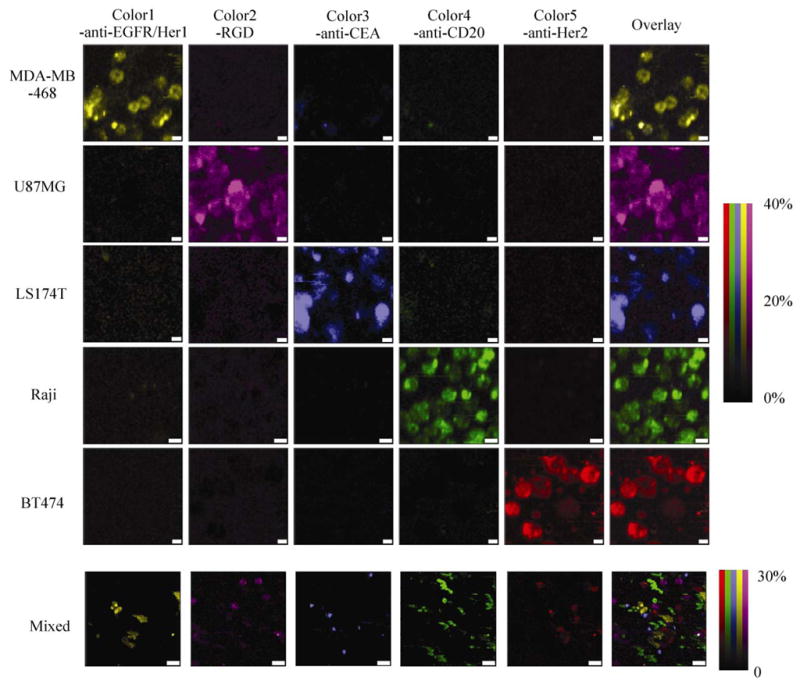
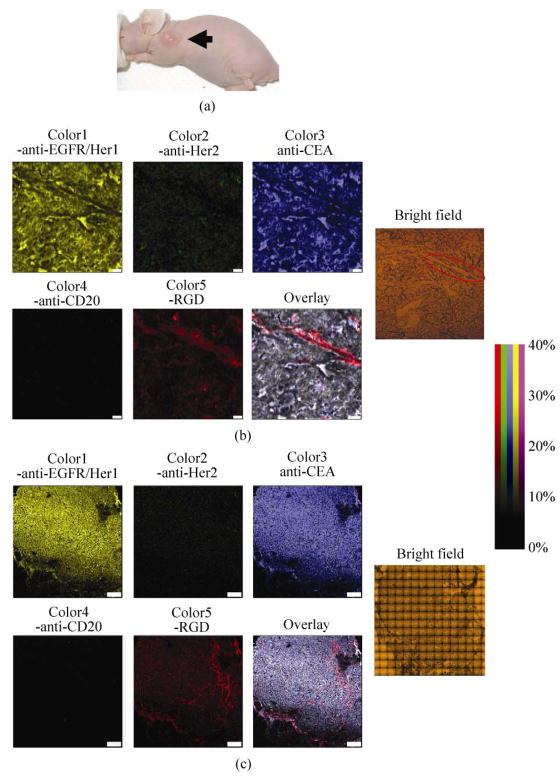
Single-walled carbon nanotubes (SWNTs) with five different C13/C12 isotope compositions and well-separated Raman peaks have been synthesized and conjugated to five targeting ligands in order to impart molecular specificity. Multiplexed Raman imaging of live cells has been carried out by highly specific staining of cells with a five-color mixture of SWNTs. Ex vivo multiplexed Raman imaging of tumor samples uncovers a surprising up-regulation of epidermal growth factor receptor (EGFR) on LS174T colon cancer cells from cell culture to in vivo tumor growth. This is the first time five-color multiplexed molecular imaging has been performed in the near-infrared (NIR) region under a single laser excitation. Near zero interfering background of imaging is achieved due to the sharp Raman peaks unique to nanotubes over the low, smooth autofluorescence background of biological species.


Figures

Figure 1
Figure 1
SWNTs with different Raman “colors”. (a) Scheme of isotopically modified SWNTs, grown from FeRu catalysts, conjugated with different targeting ligands. Color1, 2, 3, 4, and 5 represent FeRu-grown SWNTs with C13 percentages (determined by the C13-methane/C12-methane growth gas ratios) of 100%, 65%, 50%, 25%, and 0%, respectively. (b) Raman spectra of the five different SWNT samples in aqueous solutions. The shift of SWNT Raman G-band peak is clearly dependent on the C13/C12 ratio in the SWNTs. The average shift between two adjacent colors is about 15 cm−1
Figure 2
Figure 2
Two-color Raman imaging of Her1 and Her2 of different breast cancer cell lines. (a) Two-color Raman images of six breast cancer cell lines. Cells were stained by a mixture of Color1-anti-EGFR/Her1 and Color5-anti-Her2 conjugates for Raman spectroscopic imaging. 150–400 cells were imaged in each mapping field. Scale bar = 50 μm. (b) Semiquantitative analysis of two-color Raman imaging data. Averaged Raman intensity per cell of each breast cancer cell line was calculated by dividing the sum of Raman intensity in each spectroscopic image by the total number of cells in the mapping area counted from the related optical image (see Methods section), and normalized by Raman scattering intensity factors of two types of SWNTs (Fig. S-2 in the ESM). Relative EGFR/Her1 and Her2 expression levels were determined by the average Raman intensities of Color1 and Color5 per cell, respectively. Error bars were based on triplicated images
Figure 3
Figure 3
Five-color Raman imaging of cancer cells. In the top 5 rows (scale bars = 10 μm), each cell line was stained by a five-color multiplexed SWNT mixture for Raman spectroscopic imaging. In the bottom row (scale bars = 40 μm), 5 types of cancer cells were mixed together and the incubated with the five-color SWNT mixture. Spectral deconvolution was used to resolve different colors of SWNTs (see ESM). The colors are scaled as the percentage of the maximum relative Raman intensity of the deconvoluted spectra (the most intense spectrum of any color is assigned 100%). Spectra of five SWNT solutions at the same optical density (OD) as the excitation wavelength were inputted to deconvolute the raw data (Fig. S-2 in the ESM)
Figure 4
Figure 4
Multi-color ex vivo tumor imaging by Raman imaging. Note that SWNT conjugates used here were different from those used in the previous cell imaging experiments. Hipco SWNTs (C12) with a greater Raman scattering intensity factor were used as Color5. (a) A photo of a LS174T tumor-bearing nude mouse used in this study. The arrow is pointing to a tumor. (b) Five-color Raman images of a LS174T human colon tumor slice from a mouse model. Separate images representing five protein expression levels were generated by deconvoluting the raw spectra at each pixel into fractional percentages of the five intensity factor-corrected, G-band spectra. Colors are plotted as a percentage of maximum intensity (the most intense pixel of any color is assigned 100%). The overlay image exemplifies the high degree of correlation between CEA expression and EGFR expression. Note that in overlay images Color5-RGD intensity is doubled for clarity. LS174T cells in the tumor showed high levels of EGFR/Her1 (yellow) and CEA (blue) receptors, and colocalization. Integrin expression visualized by Color5-RGD Raman staining (red) appeared to be on the tumor vessels. A relatively low level of Her2 expression was also observed on LS174T tumor cells. Right: a corresponding bright field optical image of the tumor slice. The highlighted area is a tumor vessel. Integrin expression, likely that of αvβ3, was clearly associated with blood vessels in the tumor. Scale bar = 50 μm. (c) Large area whole tumor slice five-color Raman images. Five separate images for each protein expression level were generated as in Fig. 4(b), and are accompanied by an overlay image, in which Color5-RGD intensity has been doubled for clarity. The bright field image of the whole tumor slice was obtained by stacking multiple small area images taken under a 10× objective. Blood vessels going through the tumor are clearly visualized in the Color5 image. Scale bar = 1 mm

References

    1. Massoud TF, Gambhir SS. Molecular imaging in living subjects: Seeing fundamental biological processes in a new light. Gene Dev. 2003;17:545–580. - PubMed
    1. Wagnieres GA, Star WM, Wilson BC. In vivo fluorescence spectroscopy and imaging for oncological applications. Photochem Photobiol. 1998;68:603–632. - PubMed
    1. Song LL, Hennink EJ, Young IT, Tanke HJ. Photobleaching kinetics of fluorescein in quantitative fluorescence microscopy. Biophys J. 1995;68:2588–2600. - PMC - PubMed
    1. Aubin JE. Autofluorescence of viable cultured mammalian-cells. J Histochem Cytochem. 1979;27:36–43. - PubMed
    1. Frangioni JV. In vivo near-infrared fluorescence imaging. Curr Opin Chem Biol. 2003;7:626–634. - PubMed