. 2011 Apr;53(4):1192-205.
doi: 10.1002/hep.24108.

Matrix stiffness modulates proliferation, chemotherapeutic response, and dormancy in hepatocellular carcinoma cells

Affiliations

Matrix stiffness modulates proliferation, chemotherapeutic response, and dormancy in hepatocellular carcinoma cells

Jörg Schrader et al. Hepatology. 2011 Apr.

Abstract

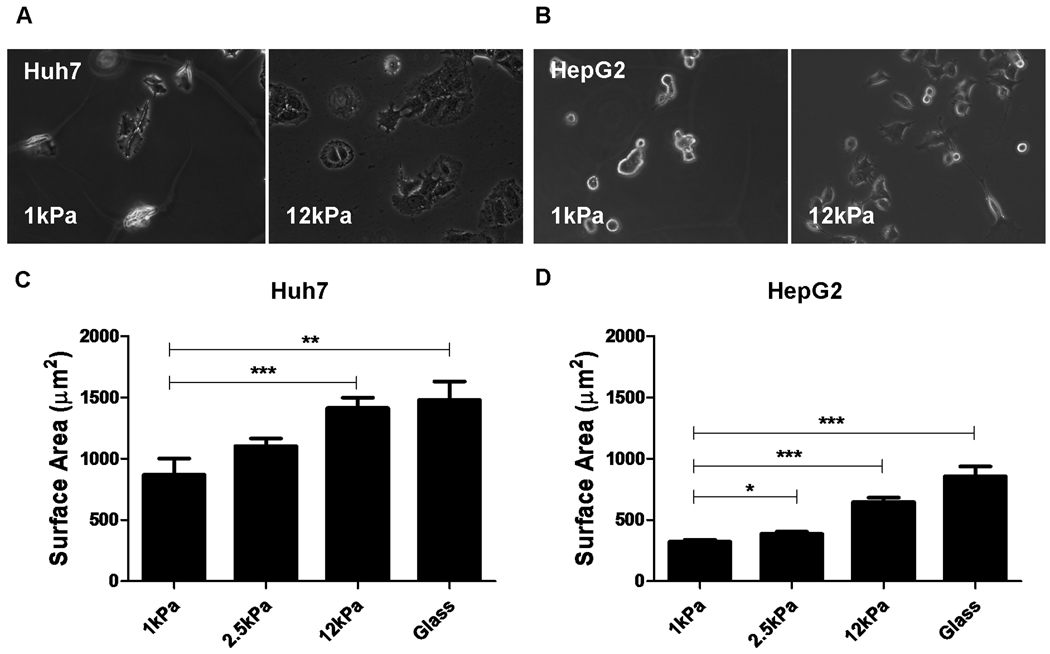
There is increasing evidence that the physical environment is a critical mediator of tumor behavior. Hepatocellular carcinoma (HCC) develops within an altered biomechanical environment, and increasing matrix stiffness is a strong predictor of HCC development. The aim of this study was to establish whether changes in matrix stiffness, which are characteristic of inflammation and fibrosis, regulate HCC cell proliferation and chemotherapeutic response. Using an in vitro system of "mechanically tunable" matrix-coated polyacrylamide gels, matrix stiffness was modeled across a pathophysiologically relevant range, corresponding to values encountered in normal and fibrotic livers. Increasing matrix stiffness was found to promote HCC cell proliferation. The proliferative index (assessed by Ki67 staining) of Huh7 and HepG2 cells was 2.7-fold and 12.2-fold higher, respectively, when the cells were cultured on stiff (12 kPa) versus soft (1 kPa) supports. This was associated with stiffness-dependent regulation of basal and hepatocyte growth factor-stimulated mitogenic signaling through extracellular signal-regulated kinase, protein kinase B (PKB/Akt), and signal transducer and activator of transcription 3. β1-Integrin and focal adhesion kinase were found to modulate stiffness-dependent HCC cell proliferation. Following treatment with cisplatin, we observed reduced apoptosis in HCC cells cultured on stiff versus soft (physiological) supports. Interestingly, however, surviving cells from soft supports had significantly higher clonogenic capacity than surviving cells from a stiff microenvironment. This was associated with enhanced expression of cancer stem cell markers, including clusters of differentiation 44 (CD44), CD133, c-kit, cysteine-X-cysteine receptor 4, octamer-4 (CXCR4), and NANOG.

Conclusion: Increasing matrix stiffness promotes proliferation and chemotherapeutic resistance, whereas a soft environment induces reversible cellular dormancy and stem cell characteristics in HCC. This has implications for both the treatment of primary HCC and the prevention of tumor outgrowth from disseminated tumor cells. (HEPATOLOGY 2011;).


Figures

Figure 1
Figure 1. Changes in matrix stiffness regulate HCC cell morphology and spreading
Huh7 and HepG2 cells were cultured on collagen-I-coated polyacrylamide gels with “tunable stiffness” (expressed as shear modulus, G’) in the range of 1–12kPa and collagen-I-coated glass. The stiffness values of the polyacrylamide gel supports used were selected in order to reflect range of stiffness values encountered in normal and fibrotic livers. Phase-contrast photomicrographs demonstrate the regulation of cellular morphology by support stiffness in both (A) Huh7 and (B) HepG2 cells. The surface area (square microns) of (C) Huh7 and (D) HepG2 cells was calculated by digital image analysis of phase-contrast images of cells on polyacrylamide gel supports. In each case, values reflect the mean (±SEM) of measurements from 50 cells in 3 independent experiments (*p<0.05, **p<0.01 and ***p<0.001).
Figure 2
Figure 2. Changes in matrix stiffness regulate the formation of actin stress fibers and focal adhesion maturation in HCC cells
Confocal microscopy (×320 magnification) of (A) Huh7 and (B) HepG2 cultured on soft (1kPa) and stiff (12kPa) collagen-I-coated polyacrylamide supports as indicated. The photomicrographs displayed are of cells stained for the presence of actin stress fibers (phalloidin-green), mature focal adhesions (anti-vinculin-red) and nuclear DNA (4’, 6’-diamidino-2-phenyl-indole dihydrochloride (DAPI-blue). The merged image (right panel) demonstrates the spatial relationship between actin stress fibers and mature focal adhesions. Inserts display high magnification images for Huh7 and HepG2 cells cultured on stiff (12kPa) supports demonstrating the insertion of actin stress fibers into mature focal adhesions. In each image, the scale bars represent 20 microns.
Figure 3
Figure 3. Increased matrix stiffness is associated with mesenchymal shift in HCC cells
(A). Western blot from whole cell lysates showing expression of E-cadherin, N-cadherin and vimentin in Huh7 and HepG2 cells cultured on soft (1kPa) and stiff (12kPa) collagen-I-coated polyacrylamide gel supports (as indicated). (B). Western blots from whole cell lysates showing expression of albumin, hepatocyte nuclear factor 4 alpha (HNF4α), α1-antitrypsin and alpha-fetoprotein (AFP) in Huh7 and HepG2 cells. (C). Western blots from whole cell lysates from Huh7 cells showing the expression of phospho-Smad2, phospho-Smad3 and total Smad2/3 following stimulation with transforming growth factor beta (TGFβ) (5ng/ml). In each western blot equal quantities of protein were loaded and equal loading confirmed in relation to glyceraldehyde 3-phosphate dehydrogenase (GAPDH) expression. In each case the western blots shown are representative examples from 3 independent experiments. (D) The line graphs show a schematic representation of densitometry analysis of phosphorylated Smad2 and Smad3, expressed relative to GAPDH. Each time-point represents the mean of three independent experiments.
Figure 4
Figure 4. Increased matrix stiffness promotes HCC cell proliferation
(A) Graphs showing the mean proliferative index (Ki67 positivity) of Huh7 and HepG2 cells cultured on collagen-I-coated polyacrylamide gel supports across a range of stiffness values (1–12kPa), as indicated, and collagen-I-coated glass (n=3). (B). Western blots from whole cell lysates showing expression of cyclin-D1 and cyclin-D3 in Huh7 and HepG2 cells cultured on soft (1kPa) and stiff (12kPa) supports, as indicated. (C) Western blots from whole cell lysates showing expression of cyclin-dependent kinase inhibitors, p21cip and p27kip in Huh7 and HepG2, cultured on soft (1kPa) and stiff (12kPa) supports, as indicated. In each western blot, equal quantities of protein were loaded and equal loading confirmed in relation to glyceraldehyde 3-phosphate dehydrogenase (GAPDH) expression. The western blots shown are representative examples from 3–6 independent experiments. (D). Graphs showing the mean proliferative index (Ki67 positivity) of Huh7 (left panel) and HepG2 (right panel) cells cultured on both soft (1kPa) and stiff (12kPa) polyacrylamide supports coated with collagen-I, collagen-IV, laminin or fibronectin (n=3). In each case, error bars represent SEM, *p<0.05, **p<0.01 and ***p<0.001.
Figure 5
Figure 5. Matrix stiffness regulates mitogenic signaling in HCC
(A) Western blots showing basal expression of phosphorylated and total focal adhesion kinase (FAK), extracellular-regulated kinase ERK, protein kinase B (PKB/Akt) and signal transducer and activator of transcription 3 (STAT3) in Huh7 and HepG2 cells cultured on soft (1kPa) and stiff (12kPa) supports, as indicated. (B). Western blots showing cyclin D1 expression in Huh7 and HepG2 cells cultured for 24 hours on soft (1kPa) and stiff (12kPa) supports in the presence (+) or absence (−) of hepatocyte growth factor (HGF) (10ng/ml). (C). Western blots showing a time-course analysis for expression of phosphorylated and total ERK, PKB/ Akt and STAT3 in Huh7 cells cultured on soft (1kPa) and stiff (12kPa) supports. Whole cell lysates were harvested at baseline and specific timepoints (as indicated) following the addition of HGF (10ng/ml) to culture media. In each western blot, equal quantities of protein were loaded and equal loading confirmed in relation to glyceraldehyde 3-phosphate dehydrogenase (GAPDH) expression. The line graphs (right panel) show a schematic representation of densitometry analysis of phosphorylated ERK, PKB/ Akt and STAT3 expressed relative to GAPDH. Each time-point represents the mean of three independent experiments.
Figure 6
Figure 6. β1 Integrin and phospho-FAK are expressed in human HCC tumors and regulate the stiffness-dependent proliferation of human HCC cells in vitro
(A) Low magnification (×50) photomicrographs from a human HCC resection specimen stained with haematoxylin and eosin (left panel), anti-β1-integrin (middle panel) and anti-phospho-FAK (right panel). Negative control staining is represented by the indented images in the top right-hand corner of each image. β1-integrin is expressed in both the HCC tumor (HCC) and surrounding hepatic parenchyma (P), as indicated. Phospho-FAKTyr397 is strongly expressed in the HCC tissue relative to the hepatic parenchyma. Scale bars represent 200 microns. (B) Western blots showing the expression of phospho-FAKTyr397 in Huh7 and HepG2 cells either left untreated or treated for 24 hours with the focal adhesion kinase (FAK) inhibitor PF573228 at concentrations of 1µM and 5µM, as indicated. In each western blot, equal quantities of protein were loaded and equal loading confirmed in relation to glyceraldehyde 3-phosphate dehydrogenase (GAPDH) expression. (C) Graphs showing the mean proliferative index (Ki67 positivity) of Huh7 and HepG2 cells cultured on 12kPa (stiff) collagen-I-coated polyacrylamide supports. Cells were treated with the anti-β1-integrin antibody 6S6 (50µg/ml), isotype control IgG1 antibody (50µg/ml), echistatin (100nm), PF573228 (1µM), PF573228 (5µM), DMSO (vehicle control) or left in media alone (untreated control) for 24 hours, as indicated (n=3–5). In each case, error bars represent SEM, *p<0.05, **p<0.01 and ***p<0.001.
Figure 7
Figure 7. Matrix stiffness regulates apoptosis and clonogenic capacity following chemotherapy
(A) Western blot showing full-length (116kDa) and cleaved poly-ADP-ribose polymerase (PARP) (89kDa) expression in Huh7 and HepG2 cells following treatment with cisplatin on soft (1kPa) and stiff (12kPa) supports, as indicated. In each western blot, equal quantities of protein were loaded and equal loading confirmed in relation to glyceraldehyde 3-phosphate dehydrogenase (GAPDH) expression. The western blots shown are representative examples from 3 independent experiments. (B) Colony formation potential of Huh7 and HepG2 cells following chemotherapy. Huh7 and HepG2 cells were cultured for 48 hours on either soft (1kPa) or stiff (12kPa) polyacrylamide supports. Cells were then left untreated (left panel) or treated with cisplatin (middle panel) or 5-fluorouracil (5-FU) (right panel) for 24 hours prior to media change. After a further 48 hours in culture, the cells were trypsinized and equal numbers re-plated at clonal density in 12-well plates. Clonogenic capacity was calculated by direct counting of the resulting colonies. The results are expressed as the percentage colony formation relative to the number of colonies obtained from 1kPa supports from three independent experiments.
Figure 8
Figure 8. Matrix stiffness and chemotherapy regulate stem cell marker expression in HepG2 cells
(A) Quantification by flow cytometric analysis of putative cancer stem cell markers CD133, c-kit, CD44 and CXCR-4 in HepG2 cells cultured for 5 days on soft (1kPa) or stiff (12kPa) supports. Cells were either left untreated (black) or treated for 24 hours with cisplatin (white). Results are representative of three independent experiments. (B) Real-time quantitative PCR analysis of octamer-4 (OCT4) (left panel) and NANOG (right panel) expression in HepG2 cells cultured for 5-days on soft (1kPa) or stiff (12kPa) supports. Cells were either left untreated (black) or treated for 24 hours with cisplatin (white). Expression is relative to the 18S housekeeping gene. In each case, error bars represent SEM, *p<0.05, **p<0.01 and ***p<0.001.

References

    1. Parkin DM, Bray F, Ferlay J, Pisani P. Estimating the world cancer burden: Globocan 2000. Int J Cancer. 2001;94(2):153–156. - PubMed
    1. Fattovich G, Stroffolini T, Zagni I, Donato F. Hepatocellular carcinoma in cirrhosis: incidence and risk factors. Gastroenterology. 2004;127(5) Suppl 1:S35–S50. - PubMed
    1. Masuzaki R, Tateishi R, Yoshida H, Goto E, Sato T, Ohki T, et al. Prospective risk assessment for hepatocellular carcinoma development in patients with chronic hepatitis C by transient elastography. Hepatology. 2009;49(6):1954–1961. - PubMed
    1. Masuzaki R, Tateishi R, Yoshida H, Sato T, Ohki T, Goto T, et al. Assessing liver tumor stiffness by transient elastography. Hepatol Int. 2007;1(3):394–397. - PMC - PubMed
    1. Ingber DE. Can cancer be reversed by engineering the tumor microenvironment? Semin Cancer Biol. 2008;18(5):356–364. - PMC - PubMed

Publication types

MeSH terms

Substances