

Altered inflammatory, oxidative, and metabolic responses to exercise in pediatric obesity and type 1 diabetes
- PMID: 21443585
- PMCID: PMC2945245
- DOI: 10.1111/j.1399-5448.2010.00724.x
Altered inflammatory, oxidative, and metabolic responses to exercise in pediatric obesity and type 1 diabetes
Abstract
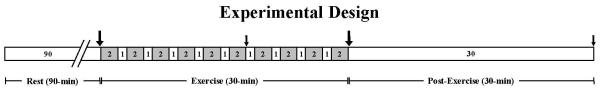
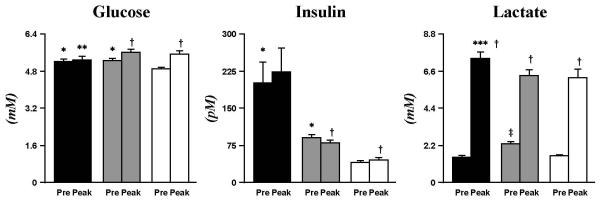
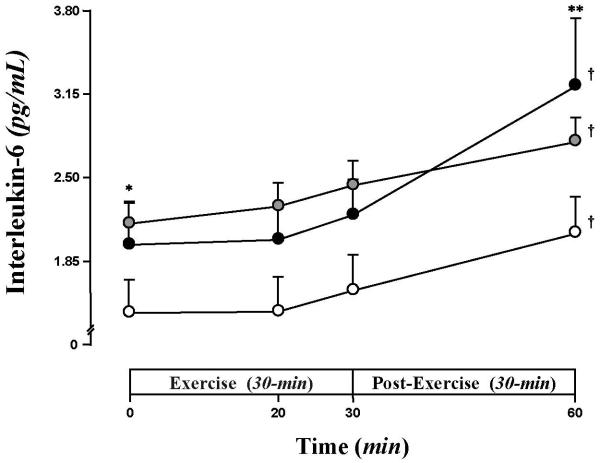
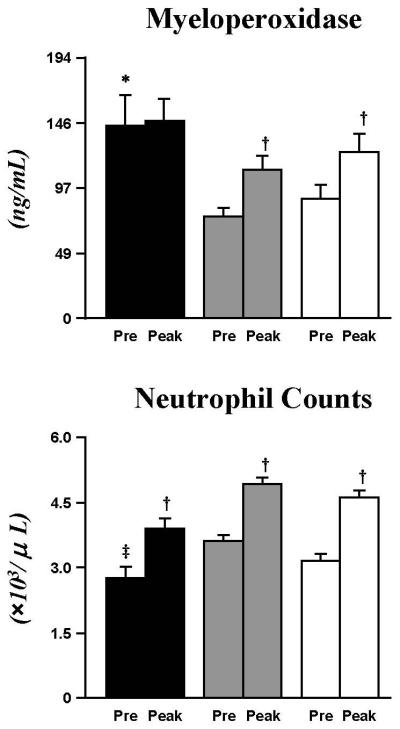
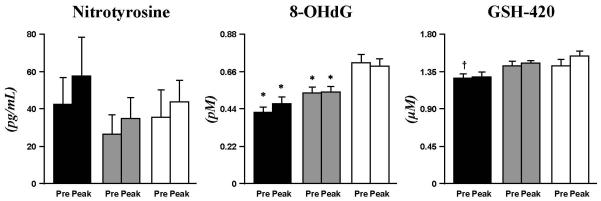
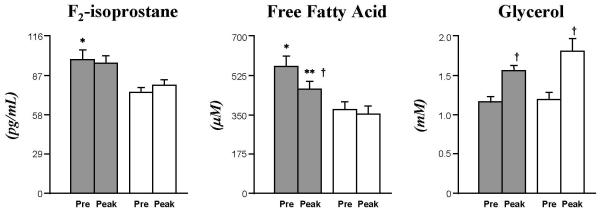
Obesity (Ob) and type 1 diabetes (T1DM) are associated with increased inflammation and oxidative stress, which are major pathogenetic pathways toward higher cardiovascular risks. Although long-term exercise protects against systemic inflammation and oxidation, acute exercise actually exerts pro-inflammatory and oxidative effects, prompting the necessity for better defining these molecular processes in at-risk patients; in particular, very little is known regarding obese and T1DM children. We therefore examined key inflammatory and oxidative stress variables during exercise in 138 peripubertal children (47 Ob, 12.7 ± 0.4 yr, 22 F, BMI% 97.6 ± 0.2; 49 T1DM, 13.9 ± 0.2 yr, 20 F, body mass index% [BMI] 63.0 ± 3.6; 42 healthy, CL, 13.5 ± 0.5 yr, 24 F, BMI% 57.0 ± 3.6), who performed 10 bouts of 2-min cycling ~80% VO(2max) , separated by 1-min rest intervals. Blood samples were drawn at baseline and peak exercise. Ob displayed elevated baseline interleukin-6 (IL-6, 2.1 ± 0.2 pg/mL, p < 0.005) vs. CL (1.5 ± 0.3), whereas T1DM displayed the greatest maximum exercise-induced change in IL-6 (1.2 ± 0.3) than in both Ob (0.7 ± 0.1, p < 0.001) and CL (0.6 ± 0.1, p < 0.0167). Myeloperoxidase (MPO) was elevated in T1DM (143 ± 30 ng/mL, p < 0.0167) vs. CL (89 ± 10) and Ob (76 ± 6), whereas increases in exercise only occurred in Ob and CL. Disparate baseline and exercise responses were also observed for 8-hydroxy-2'-deoxyguanosine, glutathione, and F(2) -isoprostane. This data show distinct patterns of dysregulation in baseline and adaptive immunologic and oxidative responses to exercise in Ob and T1DM. A full understanding of these alterations is required so that developing exercise regimens aimed at maximizing health benefits for specific dysmetabolic states can be achieved based on complete scientific characterization rather than empirical implementation.
© 2011 John Wiley & Sons A/S.
Figures
Comment in
-
The exercise-induced inflammatory and oxidative state paradox.Pediatr Diabetes. 2011 Aug;12(5):461-3. doi: 10.1111/j.1399-5448.2011.00804.x. Pediatr Diabetes. 2011. PMID: 21794044 No abstract available.
References
-
- Hedley AA, Ogden CL, Johnson CL, Carroll MD, Curtin LR, Flegal KM. Prevalence of overweight and obesity among US children, adolescents, and adults, 1999-2002. JAMA. 2004 Jun 16;291(23):2847–50. - PubMed
-
- DIAMOND Project Group Incidence and trends of childhood Type 1 diabetes worldwide 1990-1999. Diabet Med. 2006 Aug;23(8):857–66. - PubMed
-
- Brownlee M. Biochemistry and molecular cell biology of diabetic complications. Nature. 2001 Dec 13;414(6865):813–20. - PubMed
-
- Kristiansen OP, Mandrup-Poulsen T. Interleukin-6 and diabetes: the good, the bad, or the indifferent? Diabetes. 2005 Dec;54(Suppl 2):S114–S124. - PubMed
Publication types
MeSH terms
Substances
Grants and funding
LinkOut - more resources
Full Text Sources
Medical
Research Materials
Miscellaneous
