Spatial structure and nest demography reveal the influence of competition, parasitism and habitat quality on slavemaking ants and their hosts
- PMID: 21443778
- PMCID: PMC3078833
- DOI: 10.1186/1472-6785-11-9
Spatial structure and nest demography reveal the influence of competition, parasitism and habitat quality on slavemaking ants and their hosts
Abstract
Background: Natural communities are structured by intra-guild competition, predation or parasitism and the abiotic environment. We studied the relative importance of these factors in two host-social parasite ecosystems in three ant communities in Europe (Bavaria) and North America (New York, West Virginia). We tested how these factors affect colony demography, life-history and the spatial pattern of colonies, using a large sample size of more than 1000 colonies. The strength of competition was measured by the distance to the nearest competitor. Distance to the closest social parasite colony was used as a measure of parasitism risk. Nest sites (i.e., sticks or acorns) are limited in these forest ecosystems and we therefore included nest site quality as an abiotic factor in the analysis. In contrast to previous studies based on local densities, we focus here on the positioning and spatial patterns and we use models to compare our predictions to random expectations.
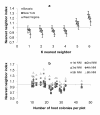
Results: Colony demography was universally affected by the size of the nest site with larger and more productive colonies residing in larger nest sites of higher quality. Distance to the nearest competitor negatively influenced host demography and brood production in the Bavarian community, pointing to an important role of competition, while social parasitism was less influential in this community. The New York community was characterized by the highest habitat variability, and productive colonies were clustered in sites of higher quality. Colonies were clumped on finer spatial scales, when we considered only the nearest neighbors, but more regularly distributed on coarser scales. The analysis of spatial positioning within plots often produced different results compared to those based on colony densities. For example, while host and slavemaker densities are often positively correlated, slavemakers do not nest closer to potential host colonies than expected by random.
Conclusions: The three communities are differently affected by biotic and abiotic factors. Some of the differences can be attributed to habitat differences and some to differences between the two slavemaking-host ecosystems. The strong effect of competition in the Bavarian community points to the scarcity of resources in this uniform habitat compared to the other more diverse sites. The decrease in colony aggregation with scale indicates fine-scale resource hotspots: colonies are locally aggregated in small groups. Our study demonstrates that species relationships vary across scales and spatial patterns can provide important insights into species interactions. These results could not have been obtained with analyses based on local densities alone. Previous studies focused on social parasitism and its effect on host colonies. The broader approach taken here, considering several possible factors affecting colony demography and not testing each one in isolation, shows that competition and environmental variability can have a similar strong impact on demography and life-history of hosts. We conclude that the effects of parasites or predators should be studied in parallel to other ecological influences.
Figures


References
-
- Sih A. In: Ecology of predator-prey interactions. Barbosa P, Castellanos I, editor. Oxford, UK: Oxford University Press; 2005. Predator-prey space use as an emergent outcome of a behavioral response race; pp. 256–278.
-
- Scharf I, Kotler BP, Ovadia O. Consequences of food distribution for optimal searching behavior: an evolutionary model. Evolutionary Ecology. 2009;23:245–259. doi: 10.1007/s10682-007-9220-6. - DOI
-
- Barraquand F, Inchausti P, Bretagnolle V. Cognitive abilities of a central place forager interact with prey spatial aggregation in their effect on intake rate. Animal Behaviour. 2009;78:505–514. doi: 10.1016/j.anbehav.2009.06.008. - DOI
-
- Mayor SJ, Schneider DC, Schaefer JA, Mahoney SP. Habitat selection at multiple scales. Ecoscience. 2009;16:238–247. doi: 10.2980/16-2-3238. - DOI
Publication types
MeSH terms
LinkOut - more resources
Full Text Sources

