

Comparative analysis of mitochondrial genomes between a wheat K-type cytoplasmic male sterility (CMS) line and its maintainer line
- PMID: 21443807
- PMCID: PMC3079663
- DOI: 10.1186/1471-2164-12-163
Comparative analysis of mitochondrial genomes between a wheat K-type cytoplasmic male sterility (CMS) line and its maintainer line
Abstract
Background: Plant mitochondria, semiautonomous organelles that function as manufacturers of cellular ATP, have their own genome that has a slow rate of evolution and rapid rearrangement. Cytoplasmic male sterility (CMS), a common phenotype in higher plants, is closely associated with rearrangements in mitochondrial DNA (mtDNA), and is widely used to produce F1 hybrid seeds in a variety of valuable crop species. Novel chimeric genes deduced from mtDNA rearrangements causing CMS have been identified in several plants, such as rice, sunflower, pepper, and rapeseed, but there are very few reports about mtDNA rearrangements in wheat. In the present work, we describe the mitochondrial genome of a wheat K-type CMS line and compare it with its maintainer line.
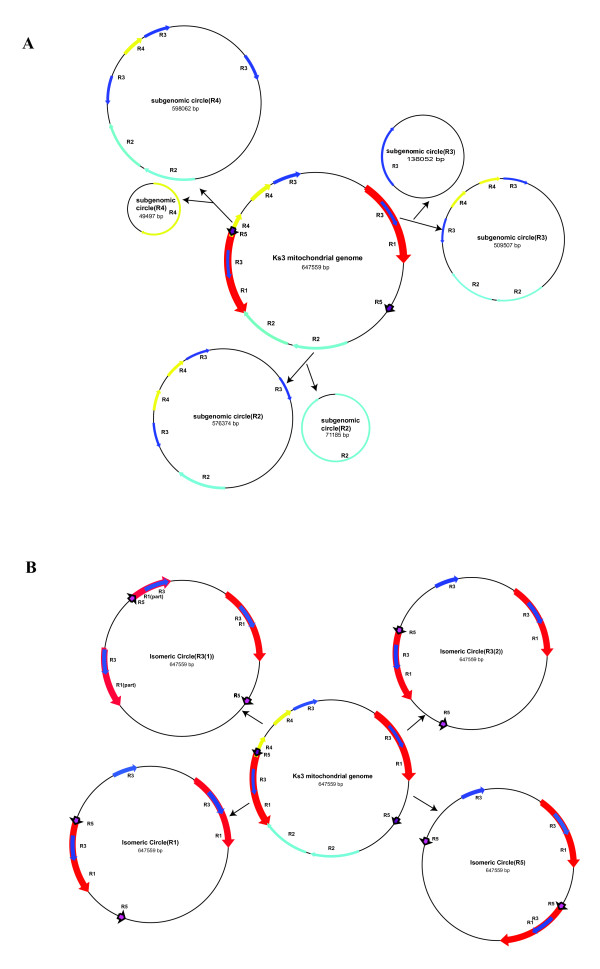
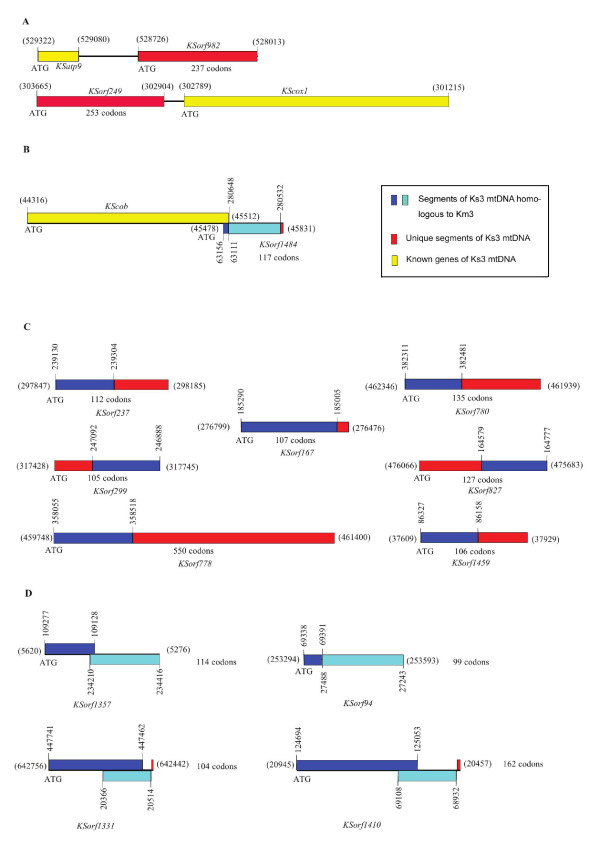
Results: The complete mtDNA sequence of a wheat K-type (with cytoplasm of Aegilops kotschyi) CMS line, Ks3, was assembled into a master circle (MC) molecule of 647,559 bp and found to harbor 34 known protein-coding genes, three rRNAs (18 S, 26 S, and 5 S rRNAs), and 16 different tRNAs. Compared to our previously published sequence of a K-type maintainer line, Km3, we detected Ks3-specific mtDNA (> 100 bp, 11.38%) and repeats (> 100 bp, 29 units) as well as genes that are unique to each line: rpl5 was missing in Ks3 and trnH was absent from Km3. We also defined 32 single nucleotide polymorphisms (SNPs) in 13 protein-coding, albeit functionally irrelevant, genes, and predicted 22 unique ORFs in Ks3, representing potential candidates for K-type CMS. All these sequence variations are candidates for involvement in CMS. A comparative analysis of the mtDNA of several angiosperms, including those from Ks3, Km3, rice, maize, Arabidopsis thaliana, and rapeseed, showed that non-coding sequences of higher plants had mostly divergent multiple reorganizations during the mtDNA evolution of higher plants.
Conclusion: The complete mitochondrial genome of the wheat K-type CMS line Ks3 is very different from that of its maintainer line Km3, especially in non-coding sequences. Sequence rearrangement has produced novel chimeric ORFs, which may be candidate genes for CMS. Comparative analysis of several angiosperm mtDNAs indicated that non-coding sequences are the most frequently reorganized during mtDNA evolution in higher plants.
Figures


Similar articles
-
Discovery of global genomic re-organization based on comparison of two newly sequenced rice mitochondrial genomes with cytoplasmic male sterility-related genes.BMC Genomics. 2010 Mar 29;11:209. doi: 10.1186/1471-2164-11-209. BMC Genomics. 2010. PMID: 20346185 Free PMC article.
-
Extensive structural variations between mitochondrial genomes of CMS and normal peppers (Capsicum annuum L.) revealed by complete nucleotide sequencing.BMC Genomics. 2014 Jul 4;15(1):561. doi: 10.1186/1471-2164-15-561. BMC Genomics. 2014. PMID: 24996600 Free PMC article.
-
Comparative analysis of mitochondrial genomes between the hau cytoplasmic male sterility (CMS) line and its iso-nuclear maintainer line in Brassica juncea to reveal the origin of the CMS-associated gene orf288.BMC Genomics. 2014 Apr 30;15(1):322. doi: 10.1186/1471-2164-15-322. BMC Genomics. 2014. PMID: 24884490 Free PMC article.
-
Non-coding RNAs and plant male sterility: current knowledge and future prospects.Plant Cell Rep. 2018 Feb;37(2):177-191. doi: 10.1007/s00299-018-2248-y. Epub 2018 Jan 13. Plant Cell Rep. 2018. PMID: 29332167 Review.
-
The Role of Non-Coding RNAs in Cytoplasmic Male Sterility in Flowering Plants.Int J Mol Sci. 2017 Nov 16;18(11):2429. doi: 10.3390/ijms18112429. Int J Mol Sci. 2017. PMID: 29144434 Free PMC article. Review.
Cited by
-
Transcriptomic and Proteomic Analyses of Celery Cytoplasmic Male Sterile Line and Its Maintainer Line.Int J Mol Sci. 2023 Feb 20;24(4):4194. doi: 10.3390/ijms24044194. Int J Mol Sci. 2023. PMID: 36835607 Free PMC article.
-
The Investigation of Perennial Sunflower Species (Helianthus L.) Mitochondrial Genomes.Genes (Basel). 2020 Aug 24;11(9):982. doi: 10.3390/genes11090982. Genes (Basel). 2020. PMID: 32846894 Free PMC article.
-
Mitotypes Based on Structural Variation of Mitochondrial Genomes Imply Relationships With Morphological Phenotypes and Cytoplasmic Male Sterility in Peppers.Front Plant Sci. 2019 Oct 24;10:1343. doi: 10.3389/fpls.2019.01343. eCollection 2019. Front Plant Sci. 2019. PMID: 31708952 Free PMC article.
-
Recombination Events Involving the atp9 Gene Are Associated with Male Sterility of CMS PET2 in Sunflower.Int J Mol Sci. 2018 Mar 11;19(3):806. doi: 10.3390/ijms19030806. Int J Mol Sci. 2018. PMID: 29534485 Free PMC article.
-
Comprehensive analysis of the multi-rings mitochondrial genome of Populus tomentosa.BMC Genomics. 2025 Jan 9;26(1):23. doi: 10.1186/s12864-024-11184-3. BMC Genomics. 2025. PMID: 39789431 Free PMC article.
References
-
- Margulis L, Bermudes D. Symbiosis as a mechanism of evolution: status of cell symbiosis theory. Symbiosis. 1985;1:101–124. - PubMed
-
- Schuster W, Brennicke A. The plant mitochondrial genome:physical structure, information content, RNA editing, and gene migration to the nucleus. Annu Rev Plant Physiol Plant Mol Biol. 1994;45:61–78. doi: 10.1146/annurev.pp.45.060194.000425. - DOI
Publication types
MeSH terms
Substances
LinkOut - more resources
Full Text Sources
Other Literature Sources
Molecular Biology Databases
