

Controlling for non-independence in comparative analysis of patterns across populations within species
- PMID: 21444315
- PMCID: PMC3081573
- DOI: 10.1098/rstb.2010.0311
Controlling for non-independence in comparative analysis of patterns across populations within species
Abstract
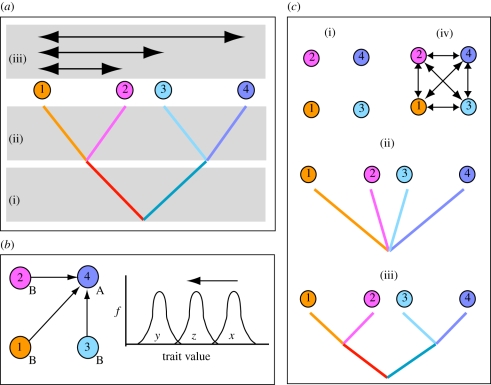
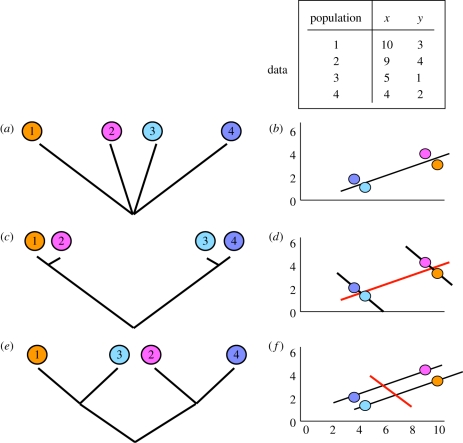
How do we quantify patterns (such as responses to local selection) sampled across multiple populations within a single species? Key to this question is the extent to which populations within species represent statistically independent data points in our analysis. Comparative analyses across species and higher taxa have long recognized the need to control for the non-independence of species data that arises through patterns of shared common ancestry among them (phylogenetic non-independence), as have quantitative genetic studies of individuals linked by a pedigree. Analyses across populations lacking pedigree information fall in the middle, and not only have to deal with shared common ancestry, but also the impact of exchange of migrants between populations (gene flow). As a result, phenotypes measured in one population are influenced by processes acting on others, and may not be a good guide to either the strength or direction of local selection. Although many studies examine patterns across populations within species, few consider such non-independence. Here, we discuss the sources of non-independence in comparative analysis, and show why the phylogeny-based approaches widely used in cross-species analyses are unlikely to be useful in analyses across populations within species. We outline the approaches (intraspecific contrasts, generalized least squares, generalized linear mixed models and autoregression) that have been used in this context, and explain their specific assumptions. We highlight the power of 'mixed models' in many contexts where problems of non-independence arise, and show that these allow incorporation of both shared common ancestry and gene flow. We suggest what can be done when ideal solutions are inaccessible, highlight the need for incorporation of a wider range of population models in intraspecific comparative methods and call for simulation studies of the error rates associated with alternative approaches.
Figures
Similar articles
-
Population genetics and objectivity in species diagnosis.Evolution. 2012 May;66(5):1413-29. doi: 10.1111/j.1558-5646.2011.01542.x. Epub 2012 Jan 23. Evolution. 2012. PMID: 22519781 Free PMC article.
-
An intraspecific comparative analysis of character divergence between sympatric species.Evolution. 2005 Mar;59(3):554-64. Evolution. 2005. PMID: 15856698
-
A proper study for mankind: Analogies from the Papionin monkeys and their implications for human evolution.Am J Phys Anthropol. 2001;Suppl 33:177-204. doi: 10.1002/ajpa.10021. Am J Phys Anthropol. 2001. PMID: 11786995 Review.
-
Phylogenetic inheritance of genetic variability produced by neutral models of evolution.Genet Mol Res. 2008;7(4):1327-43. doi: 10.4238/vol7-4gmr512. Genet Mol Res. 2008. PMID: 19065768
-
Phylogenetic analyses: comparing species to infer adaptations and physiological mechanisms.Compr Physiol. 2012 Jan;2(1):639-74. doi: 10.1002/cphy.c100079. Compr Physiol. 2012. PMID: 23728983 Review.
Cited by
-
Microsatellite DNA suggests that group size affects sex-biased dispersal patterns in red colobus monkeys.Am J Primatol. 2013 May;75(5):478-90. doi: 10.1002/ajp.22124. Epub 2013 Jan 10. Am J Primatol. 2013. PMID: 23307485 Free PMC article.
-
Dynamics of Deleterious Mutations and Purifying Selection in Small Population Isolates.Mol Biol Evol. 2025 Jul 1;42(7):msaf110. doi: 10.1093/molbev/msaf110. Mol Biol Evol. 2025. PMID: 40689857 Free PMC article.
-
Genetic population structure accounts for contemporary ecogeographic patterns in tropic and subtropic-dwelling humans.PLoS One. 2015 Mar 27;10(3):e0122301. doi: 10.1371/journal.pone.0122301. eCollection 2015. PLoS One. 2015. PMID: 25816235 Free PMC article.
-
The role of spatial processes and environmental determinants in microgeographic shell variation of the freshwater snail Chilina dombeyana (Bruguière, 1789).Naturwissenschaften. 2012 Mar;99(3):225-32. doi: 10.1007/s00114-012-0890-8. Epub 2012 Feb 12. Naturwissenschaften. 2012. PMID: 22328071
-
Population genomics perspectives on convergent adaptation.Philos Trans R Soc Lond B Biol Sci. 2019 Jul 22;374(1777):20180236. doi: 10.1098/rstb.2018.0236. Epub 2019 Jun 3. Philos Trans R Soc Lond B Biol Sci. 2019. PMID: 31154979 Free PMC article. Review.
References
-
- Ives A. R., Zhu J. 2006. Statistics for correlated data: phylogenies, space, and time. Ecol. Appl. 16, 20–3210.1890/04-0702 (doi:10.1890/04-0702) - DOI - DOI - PubMed
-
- Phillimore A. B., Hadfield J. D., Jones O. R., Smithers R. J. 2010. Differences in spawning date between populations of common frog reveal local adaptation. Proc. Natl Acad. Sci. USA 107, 8292–829710.1073/pnas.0913792107 (doi:10.1073/pnas.0913792107) - DOI - DOI - PMC - PubMed
-
- Antonovics J. 1992. Toward community genetics. In Plant resistance to herbivores and pathogens: ecology, evolution, and genetics (eds Fritz R. S., Simms E. L.), pp. 426–449 Chicago, IL: University of Chicago Press
-
- Helfield J. M., Naiman R. J. 2001. Effects of salmon-derived nitrogen on riparian forest growth and implications for stream productivity. Ecology 82, 2403–240910.1890/0012-9658(2001)082[2403:EOSDNO]2.0.CO;2 (doi:10.1890/0012-9658(2001)082[2403:EOSDNO]2.0.CO;2) - DOI - DOI
-
- Whitham T. G., et al. 2006. A framework for community and ecosystem genetics: from genes to ecosystems. Nat. Rev. Genet. 7, 510–52310.1038/nrg1877 (doi:10.1038/nrg1877) - DOI - DOI - PubMed
Publication types
MeSH terms
Grants and funding
LinkOut - more resources
Full Text Sources
Research Materials
Miscellaneous
