. 2011 Apr 11;208(4):841-51.
doi: 10.1084/jem.20102608. Epub 2011 Mar 28.

Genetic determination of the cellular basis of the sympathetic regulation of bone mass accrual

Affiliations

Genetic determination of the cellular basis of the sympathetic regulation of bone mass accrual

Daisuke Kajimura et al. J Exp Med. .

Abstract

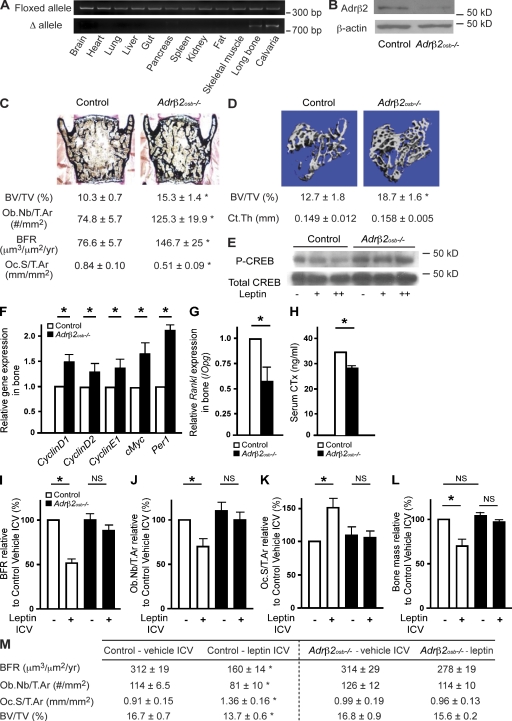
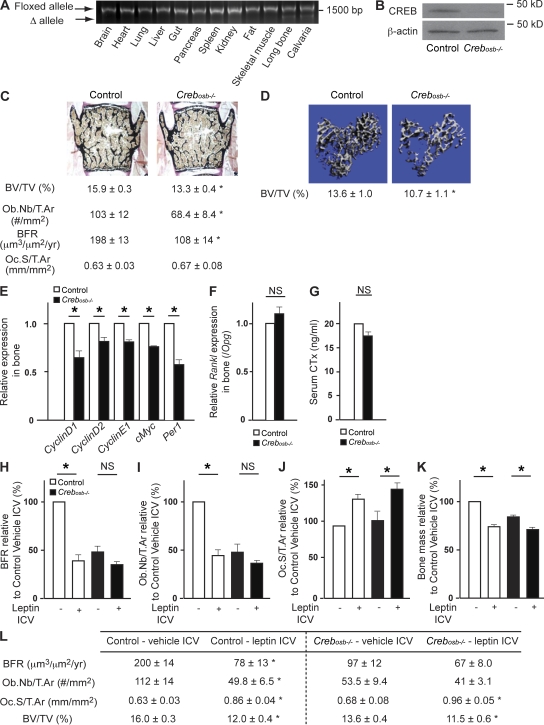
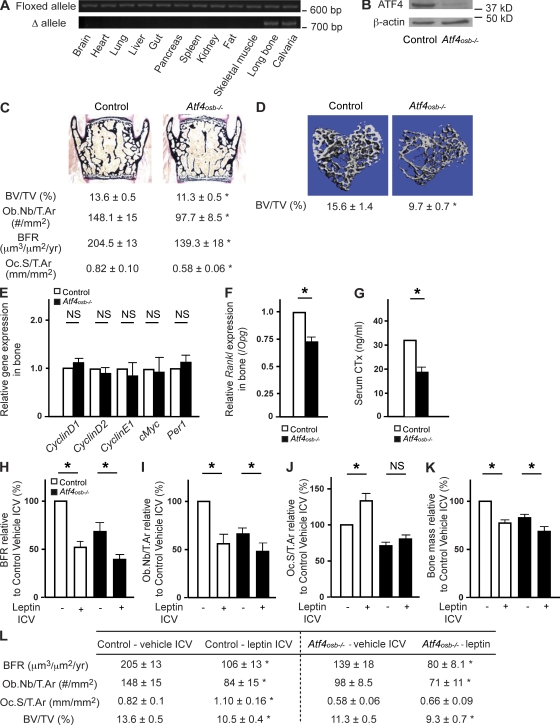
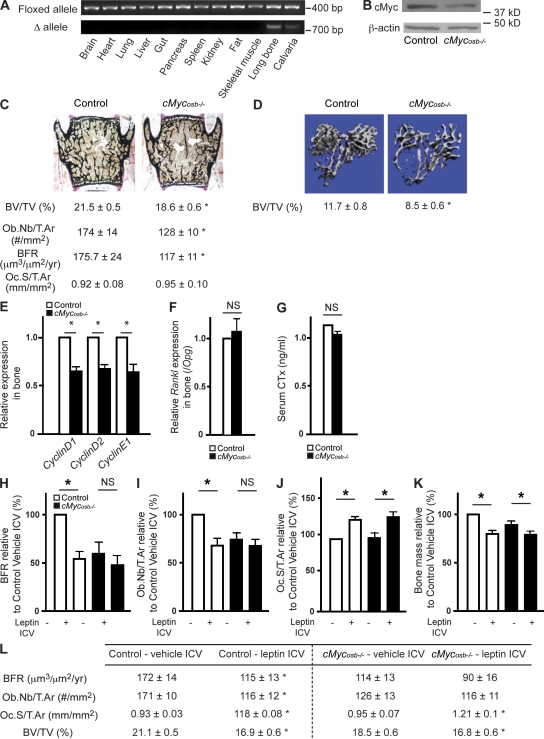
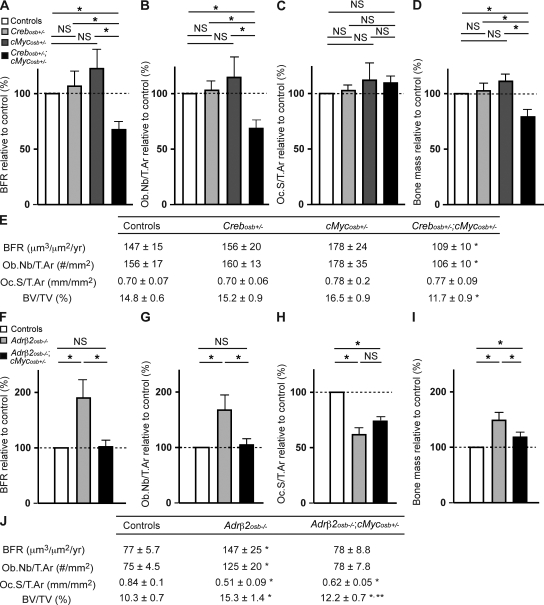
The sympathetic nervous system, whose activity is regulated by leptin signaling in the brain, is a major regulator of bone mass accrual. To determine the identity of the cell type in which the sympathetic tone signals to inhibit bone mass accrual, we performed a systematic, cell-specific analysis of the function of the β2 adrenergic receptor (Adrβ2) and various genes implicated in the pathway in the mouse. This was followed by leptin intracerebroventricular (ICV) infusion and bone histomorphometric analyses of bone parameters. We show that the sympathetic tone signals in the osteoblasts to inhibit CREB (cAMP-responsive element-binding protein) phosphorylation and thus decrease osteoblast proliferation and to promote ATF4 phosphorylation and thus increase RANKL (receptor activator of NF-κB ligand) expression, which then stimulates osteoclast differentiation. Leptin ICV infusion in various mouse models established that leptin-dependent inhibition of bone mass accrual relies on both transcriptional events taking place in osteoblasts. Thus, this study formally identifies the osteoblast as the major cell type in which the molecular events triggered by the sympathetic regulation of bone mass accrual take place. As such, it suggests that inhibiting sympathetic signaling could be beneficial in the treatment of low bone mass conditions.


Figures

Figure 1.
Figure 1.
Analysis of Adrβ2osb−/− mice. (A) Specificity of α1(I) Collagen–Cre-driven deletion of Adrβ2 allele in bone. (B) Expression level of Adrβ2 protein in bone marrow–derived osteoblasts. (C) Bone histomorphometric analysis Adrβ2osb−/− mice at 24 wk of age (control, n = 11; Adrβ2osb−/−, n = 7). Mineralized bone matrix is stained in black by Von Kossa reagent. Histomorphometric parameters: BV/TV, bone volume over tissue volume; Ob.Nb/T.Ar, number of osteoblasts per trabecular area; Oc.S/T.Ar, osteoclast surface per trabecular area. (D) µCT analysis of control (n = 6) and Adrβ2osb−/− (n = 5) proximal tibiae at 24 wk of age. Ct.Th, cortical thickness. (E) Expression of phospho-CREB and total CREB after 28-d leptin ICV infusion at 12 wk of age. (F and G) Expression of various genes in control (n = 7) and Adrβ2osb−/− (n = 7) bone at 24 wk of age. (H) Serum CTx levels of control (n = 8) and Adrβ2osb−/− (n = 7) mice at 24 wk of age. (I–L) Bone histomorphometric analysis of 12-wk-old Adrβ2osb−/− mice after leptin ICV infusion shown as percentage compared with control mice treated with vehicle ICV infusion (control mice with vehicle ICV infusion, n = 9; control mice with leptin ICV infusion, n = 8; Adrβ2osb−/− mice with vehicle ICV infusion, n = 5; Adrβ2osb−/− mice with leptin ICV infusion, n = 5). (M) Bone histomorphometric analysis of 12-wk-old Adrβ2osb−/− mice after leptin ICV infusion. All experiments were performed independently at least twice, and representative data are shown. Results are shown as mean ± SEM. Statistical analysis was performed by Student’s t test. For all panels: *, P < 0.05.
Figure 2.
Figure 2.
Analysis of Crebosb−/− mice. (A) Specificity of α1(I) Collagen–Cre-driven deletion of Creb allele in bone. (B) Expression level of the CREB protein in bone marrow–derived osteoblasts. (C) Bone histomorphometric analysis of Crebosb−/− mice at 12 wk of age (control, n = 14; Crebosb−/−, n = 12). BV/TV, bone volume over tissue volume; Ob.Nb/T.Ar, number of osteoblasts per trabecular area; Oc.S/T.Ar, osteoclast surface per trabecular area. (D) µCT analysis of control (n = 5) and Crebosb−/− (n = 5) proximal tibiae at 12 wk of age. (E and F) Expression of various genes in control (n = 7) and Crebosb−/− (n = 3) bone at 12 wk of age. (G) Serum CTx levels of control (n = 7) and Crebosb−/− (n = 7) mice at 12 wk of age. (H–K) Bone histomorphometric analysis of Crebosb−/− mice after leptin ICV infusion at 12 wk of age shown as percentage compared with control mice with vehicle ICV infusion (control mice with vehicle ICV infusion, n = 14; control mice with leptin ICV infusion, n = 12; Crebosb−/− mice with vehicle ICV infusion, n = 8; Crebosb−/− mice with leptin ICV infusion, n = 10). (L) Bone histomorphometric analysis of 12-wk-old Crebosb−/− mice after leptin ICV infusion. All experiments were performed independently at least twice, and representative data are shown. Results are shown as mean ± SEM. Statistical analysis was performed by Student’s t test. For all panels: *, P < 0.05.
Figure 3.
Figure 3.
Analysis of Atf4osb−/− mice. (A) Specificity of α1(I) Collagen–Cre-driven deletion of Atf4 allele in bone. (B) Expression level of the ATF4 protein in bone. (C) Bone histomorphometric analysis of Atf4osb−/− mice at 12 wk of age (control, n = 10; Atf4osb−/−, n = 9). BV/TV, bone volume over tissue volume; Ob.Nb/T.Ar, number of osteoblasts per trabecular area; Oc.S/T.Ar, osteoclast surface per trabecular area. (D) µCT analysis of control (n = 5) and Atf4osb−/− (n = 5) proximal tibiae at 12 wk of age. (E and F) Expression of various genes in control (n = 9) and Atf4osb−/− (n = 9) bone at 12 wk of age. (G) Serum CTx levels of control (n = 8) and Atf4osb−/− mice (n = 8) at 12 wk of age. (H–K) Bone histomorphometric analysis of Atf4osb−/− mice after leptin ICV infusion at 12 wk of age shown as percentage compared with control mice treated with vehicle ICV infusion (control mice with vehicle ICV infusion, n = 10; control mice with leptin ICV infusion, n = 9; Atf4osb−/− mice with vehicle ICV infusion, n = 9; Atf4osb−/− mice with leptin ICV infusion, n = 9). (L) Bone histomorphometric analysis of 12-wk-old Atf4osb−/− mice after leptin ICV infusion. All experiments were performed independently at least twice, and representative data are shown. Results are shown as mean ± SEM. Statistical analysis was performed by Student’s t test. For all panels: *, P < 0.05.
Figure 4.
Figure 4.
Analysis of cMycosb−/− mice. (A) Specificity of α1(I) Collagen–Cre-driven deletion of cMyc allele in bone. (B) Expression level of the cMyc protein in bone marrow–derived osteoblasts. (C) Bone histomorphometric analysis of cMycosb−/− mice at 12 wk of age (control, n = 14; cMycosb−/−, n = 9). BV/TV, bone volume over tissue volume; Ob.Nb/T.Ar, number of osteoblasts per trabecular area; Oc.S/T.Ar, osteoclast surface per trabecular area. (D) µCT analysis of control (n = 5) and cMycosb−/− (n = 5) proximal tibiae at 12 wk of age. (E and F) Expression of various genes in control (n = 3) and cMycosb−/− (n = 7) bone at 12 wk of age. (G) Serum CTx levels of control (n = 6) and cMycosb−/− (n = 6) at 12 wk of age. (H–K) Bone histomorphometric analysis of cMycosb−/− mice after leptin ICV infusion at 12 wk of age shown as percentage compared with control mice treated with vehicle ICV infusion (control mice with vehicle ICV infusion, n = 14; control mice with leptin ICV infusion, n = 8; cMycosb−/− mice with vehicle ICV infusion, n = 9; cMycosb−/− mice with leptin ICV infusion, n = 10). (L) Bone histomorphometric analysis of 12-wk-old cMycosb−/− mice after leptin ICV infusion. All experiments were performed independently at least twice, and representative data are shown. Results are shown as mean ± SEM. Statistical analysis was performed by Student’s t test. For all panels: *, P < 0.05.
Figure 5.
Figure 5.
Genetic epistasis analysis. (A–E) Bone histomorphometric analysis of Crebosb+/−;cMycosb+/− mice at 12 wk of age (controls, n = 15; Crebosb+/−, n = 9; cMycosb+/−, n = 4; Crebosb+/−;cMycosb+/−, n = 8). (F–J) Bone histomorphometric analysis of Adrβ2osb−/−;cMycosb+/− mice at 24 wk of age (controls, n = 11; Adrβ2osb−/−, n = 7; Adrβ2osb−/−;cMycosb+/−, n = 9). *, P < 0.05 between controls; **, P < 0.05 between Adrβ2osb−/− mice and Adrβ2osb−/−;cMycosb+/− mice. Experiments were performed independently twice, and representative data are shown. Results are shown as mean ± SEM. Dashed lines indicate control value of 100%. BV/TV, bone volume over tissue volume; Ob.Nb/T.Ar, number of osteoblasts per trabecular area; Oc.S/T.Ar, osteoclast surface per trabecular area.

References

    1. Bonnet N., Benhamou C.L., Malaval L., Goncalves C., Vico L., Eder V., Pichon C., Courteix D. 2008. Low dose beta-blocker prevents ovariectomy-induced bone loss in rats without affecting heart functions. J. Cell. Physiol. 217:819–827 10.1002/jcp.21564 - DOI - PubMed
    1. Chappard D., Palle S., Alexandre C., Vico L., Riffat G. 1987. Bone embedding in pure methyl methacrylate at low temperature preserves enzyme activities. Acta Histochem. 81:183–190 - PubMed
    1. Couillard M., Trudel M. 2009. C-myc as a modulator of renal stem/progenitor cell population. Dev. Dyn. 238:405–414 10.1002/dvdy.21841 - DOI - PubMed
    1. Dacquin R., Starbuck M., Schinke T., Karsenty G. 2002. Mouse alpha1(I)-collagen promoter is the best known promoter to drive efficient Cre recombinase expression in osteoblast. Dev. Dyn. 224:245–251 10.1002/dvdy.10100 - DOI - PubMed
    1. Datta N.S., Abou-Samra A.B. 2009. PTH and PTHrP signaling in osteoblasts. Cell. Signal. 21:1245–1254 10.1016/j.cellsig.2009.02.012 - DOI - PMC - PubMed

Publication types

MeSH terms

Substances