. 2011 Apr 4;193(1):141-54.
doi: 10.1083/jcb.201101039. Epub 2011 Mar 28.

A lateral belt of cortical LGN and NuMA guides mitotic spindle movements and planar division in neuroepithelial cells

Affiliations

A lateral belt of cortical LGN and NuMA guides mitotic spindle movements and planar division in neuroepithelial cells

Elise Peyre et al. J Cell Biol. .

Abstract

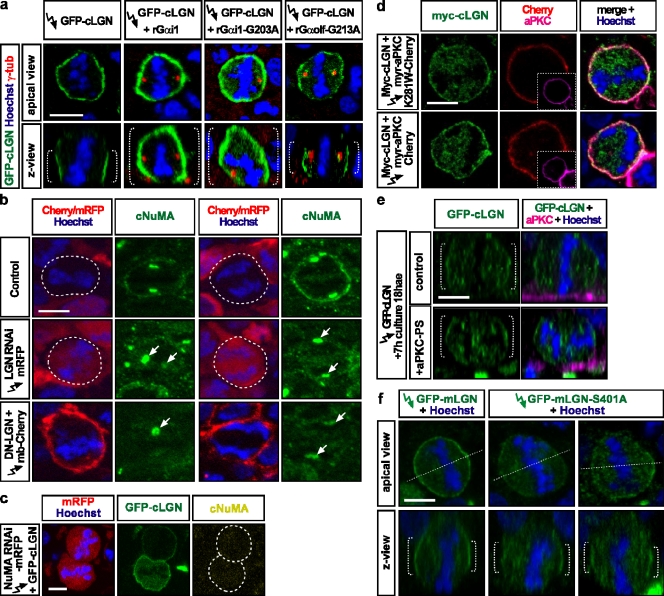
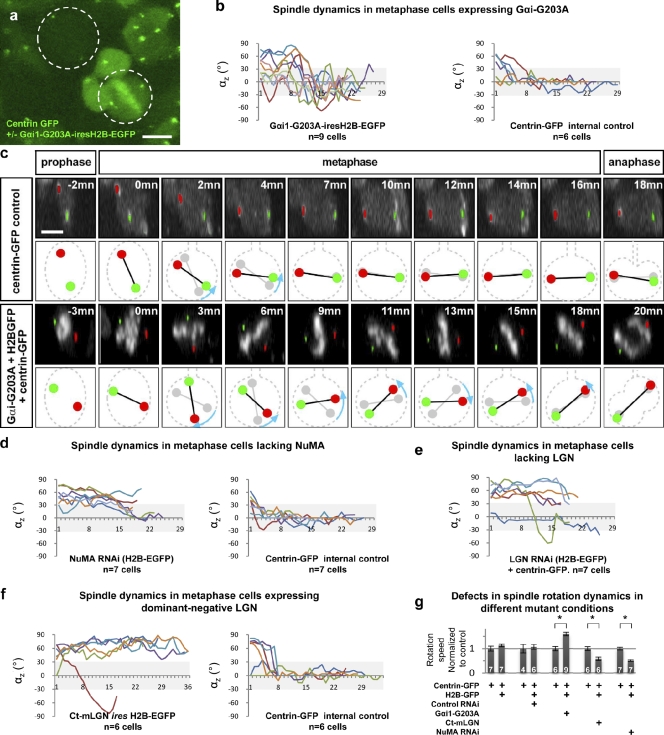
To maintain tissue architecture, epithelial cells divide in a planar fashion, perpendicular to their main polarity axis. As the centrosome resumes an apical localization in interphase, planar spindle orientation is reset at each cell cycle. We used three-dimensional live imaging of GFP-labeled centrosomes to investigate the dynamics of spindle orientation in chick neuroepithelial cells. The mitotic spindle displays stereotypic movements during metaphase, with an active phase of planar orientation and a subsequent phase of planar maintenance before anaphase. We describe the localization of the NuMA and LGN proteins in a belt at the lateral cell cortex during spindle orientation. Finally, we show that the complex formed of LGN, NuMA, and of cortically located Gαi subunits is necessary for spindle movements and regulates the dynamics of spindle orientation. The restricted localization of LGN and NuMA in the lateral belt is instructive for the planar alignment of the mitotic spindle, and required for its planar maintenance.


Figures

Figure 1.
Figure 1.
3D time-lapse imaging shows stereotypical biphasic movements of the mitotic spindle in neuroepithelial cells. (a and b) Time-lapse series of a Centrin2-GFP–expressing neuroepithelial cell in metaphase and anaphase. (a) Top row: successive apical projections of a 20-µm-thick Z-stack; bottom row: a schematic of the XY orientation of the spindle at each time point (colored spindle poles) relative to the previous time point (gray spindle poles). Purple arrows indicate the orientation of the movement between time points and reveal numerous changes in orientation during metaphase. (b) Top row: the same cell as in panel a is seen as successive vertical Z-sections along the axis of the mitotic spindle. Bottom row: a schematic of the same sections. Blue arrows indicate the rotation of the spindle relative to the apical/basal (Z) axis between successive time points. Note that within 6 min the spindle, starting from an oblique position, has aligned with the apical surface and remains aligned until anaphase. Left: 3D models of a metaphase neuroepithelial cell imaged from the apical surface (XY plane) or seen along its apical–basal axis (Z axis) are provided. Bar, 5 µm. (c) The orientation of the spindle relative to the apical surface (αZ) is random at metaphase onset (left), but by anaphase onset all the spindles have adopted a planar orientation parallel to the apical surface (right). (d) Dynamics of Z orientation (αZ) during metaphase: all cells in our study quickly align their spindle parallel to the apical surface during the first minutes of metaphase and remain aligned until anaphase. Eight representative cells are shown. (e) Dynamics of xy orientation (αXY) during metaphase: all cells exhibit active and random XY rotation throughout metaphase. The eight cells are the same as in panel b. (f) The time needed for the spindle to reach a planar orientation depends on its initial Z-orientation. (g) Centrosome velocity from 37 Centrin2-GFP+ cells during metaphase shows an inflection between 5 and 7 min. Error bars = SEM. (h) A 3D schematic of the successive movements of the spindle during metaphase. Immediately after metaphase onset, the spindle quickly undergoes a directed Z-rotation leading to planar orientation; Z rotation is then restricted to maintain planar orientation and most of the movement occurs randomly in a plane parallel to the apical surface. Throughout this figure, blue, magenta, or yellow represent movements and their measurements along the Z axis, in the XY plane, and in the three dimensions, respectively.
Figure 2.
Figure 2.
Gαi, LGN, and NuMA distribution in dividing neuroepithelial cells. (a–b′) Gαi-Venus (green) shows a homogenous cortical distribution in metaphase (a–a′) and anaphase (b–b′) cells. The three panels in a and b show single optical sections from basal (top) to sub-apical (bottom) levels, whereas a′ and b′ show a Z-view of the same cell. FOP (red) labels centrosomes. (c–d′) LGN-GFP (green) is excluded from the apical and basal cortex in metaphase (c–c′) and anaphase (d–d′) neuroepithelial cells, and forms a wide belt at the lateral cortex. (e–f′) NuMA (green) is excluded from the apical and basal cortex in metaphase (e–e′) and anaphase (f–f′) neuroepithelial cells, and forms a narrow belt at the lateral cortex. Note that f–f′ shows the same cell as d–d′. (g) Double staining for Gαi-Venus (green) and NuMA (red) show the restricted expression of cNuMA at the lateral cortex, whereas Gαi is homogeneous at the cortex. (h) Double staining for LGN-GFP (green) and NuMA (red) shows restricted expression of both proteins at the lateral cortex. Lightning arrows indicate the electroporated product. Bar, 5 µm
Figure 3.
Figure 3.
The lateral distribution of LGN and NuMA is regulated by Gαi-GDP and not by aPKC. (a) GDP-bound Gαi-subunits recruit LGN-GFP to the cell cortex. Apical (top) and Z (bottom) views of cells expressing LGN-GFP fusion protein alone or in combination with Gαi1, Gαi1-GDP, or Gαolf-GDP. LGN-GFP recruitment is increased and expanded along the apical–basal axis upon Gαi and Gαi-GDP expression. (b) NuMA is recruited to the cell cortex by LGN. Cells expressing LGN RNAi hairpin or dominant-negative LGN do not show cortical NuMA in metaphase and anaphase. Note that NuMA is still present at the spindle poles (arrows). (c) Two metaphase cells expressing a NuMA RNAi hairpin: NuMA knockdown does not prevent LGN cortical recruitment. (d) Overexpression of a ubiquitous cortical, activated form of aPKC does not inhibit LGN cortical recruitment compared with an inactive mutant version (K281W) of myristylated aPKC. (e) Inhibition of aPKC with a myristylated pseudo-substrate does not block apical exclusion of GFP-LGN. (f) Replacement of the aPKC phosphorylation site (serine 401) by an alanine residue does not block the apical exclusion of GFP-tagged mouse LGN. All images are apical views, except panel e and the bottom rows in panels a and f, which are Z-views showing the apico–basal distribution of LGN. Lightning arrows indicate the electroporated product(s). Bar, 5 µm.
Figure 4.
Figure 4.
The lateral LGN complex is required for planar cell division. (a) Spindle orientation in anaphase was measured at E3 in transverse sections of the neural tube 24 h after electroporation. Knockdowns of LGN, NuMA, and Gαi1/2 result in defects in spindle orientation compared with a control RNAi construct targeting luciferase. (b) Top: treatment with the pertussis toxin catalytic subunit (PTx-A) randomizes spindle orientation compared with electroporation with a control Myc-tag expressing vector. Bottom: representative cells with spindle orientation defects in anaphase. H2B-GFP (green) reveals the parting chromosomes in anaphase, β-catenin (red) shows the cell outline and apical surface. (c) Overexpression of Gαi-GDP (Gαi-G203A) results in spindle randomization, whereas Gαolf-GDP (Gαolf-G213A) has no effect. Solid red line in graphs: median angle. Significance was assessed using the Kolmogorov-Smirnov test. There was no significant difference between control conditions (Myc, miLuc, and Gαolf-G213A). All other conditions differed significantly from the controls. n represents the number of measured cells. Data are collected from at least five embryos for each condition. Lightning arrows indicate the electroporated product(s). Bar, 5 µm.
Figure 5.
Figure 5.
The lateral LGN complex controls the stereotypical dynamics of spindle movements. (a) Still image from a time-lapse movie showing a metaphase wild-type cell expressing Centrin2-GFP only in the same field as a mutant cell expressing Centrin2-GFP + high levels of Gαi-G203A-ires-H2B-GFP (see Materials and methods). (b) Time-course of the spindle αZ variations during metaphase indicates systematic random movements upon Gαi-G203A expression (left graph) compared with quick planar orientation of Centrin2-GFP–expressing control cells (right graph) from the same field. (c) Time-lapse analysis of spindle movements relative to the apico–basal axis in a control Centrin2-GFP (top) and a Gαi-G203A-ires-H2B-GFP + Centrin2-GFP–expressing cell (bottom), taken from the same field in the same embryo. Apical is at the bottom and Centrin2-GFP–expressing centrosomes are pseudo-colored in red and green. In the control cell, most of the Z rotation (blue arrows) occurs within the first minutes of metaphase and is directed toward planar orientation. In the Gαi-G203A–expressing cell, Z rotation occurs throughout metaphase and is randomly oriented, and anaphase occurs with a random oblique axis. (d–f) Spindle Z-rotation is decreased by reduction of NuMA (d) or LGN (e) levels with RNAi and by expression of a dominant-negative form of LGN (f). (g) Global spindle dynamics during metaphase increases when Gαi-G203A increases, and decreases in the absence of cortical LGN and NuMA. Each pair of bars compares the average dynamics of mutant cells to Centrin2-GFP–expressing cells in the same field, in the same embryo (see Materials and methods). Numbers in the bars indicate the number of cells analyzed for each genotype. Spindle dynamics was not changed by expression of H2B-GFP or a control RNAi hairpin directed against luciferase. Error bar = SEM, *, P < 0.01; unpaired student t test. Bar, 5 µm.

References

    1. Aaku-Saraste E., Oback B., Hellwig A., Huttner W.B. 1997. Neuroepithelial cells downregulate their plasma membrane polarity prior to neural tube closure and neurogenesis. Mech. Dev. 69:71–81 10.1016/S0925-4773(97)00156-1 - DOI - PubMed
    1. Adams R.J. 1996. Metaphase spindles rotate in the neuroepithelium of rat cerebral cortex. J. Neurosci. 16:7610–7618 - PMC - PubMed
    1. Baena-López L.A., Baonza A., García-Bellido A. 2005. The orientation of cell divisions determines the shape of Drosophila organs. Curr. Biol. 15:1640–1644 10.1016/j.cub.2005.07.062 - DOI - PubMed
    1. Barnes A.P., Lilley B.N., Pan Y.A., Plummer L.J., Powell A.W., Raines A.N., Sanes J.R., Polleux F. 2007. LKB1 and SAD kinases define a pathway required for the polarization of cortical neurons. Cell. 129:549–563 10.1016/j.cell.2007.03.025 - DOI - PubMed
    1. Bellaiche Y., Gotta M. 2005. Heterotrimeric G proteins and regulation of size asymmetry during cell division. Curr. Opin. Cell Biol. 17:658–663 10.1016/j.ceb.2005.10.002 - DOI - PubMed

Publication types

Associated data