. 2011 Apr 4;193(1):219-33.
doi: 10.1083/jcb.201009001. Epub 2011 Mar 28.

A hierarchy of signals regulates entry of membrane proteins into the ciliary membrane domain in epithelial cells

Affiliations

A hierarchy of signals regulates entry of membrane proteins into the ciliary membrane domain in epithelial cells

Stephen S Francis et al. J Cell Biol. .

Abstract

The membrane of the primary cilium is continuous with the plasma membrane but compositionally distinct. Although some membrane proteins concentrate in the cilium, others such as podocalyxin/gp135 are excluded. We found that exclusion reflects a saturable selective retention mechanism. Podocalyxin is immobilized by its PDZ interaction motif binding to NHERF1 and thereby to the apical actin network via ERM family members. The retention signal was dominant, autonomous, and transferable to membrane proteins not normally excluded from the cilium. The NHERF1-binding domains of cystic fibrosis transmembrane conductance regulator and Csk-binding protein were also found to act as transferable retention signals. Addition of a retention signal could inhibit the ciliary localization of proteins (e.g., Smoothened) containing signals that normally facilitate concentration in the ciliary membrane. Proteins without a retention signal (e.g., green fluorescent protein-glycosylphosphatidylinositol) were found in the cilium, suggesting entry was not impeded by a diffusion barrier or lipid microdomain. Thus, a hierarchy of interactions controls the composition of the ciliary membrane, including selective retention, selective inclusion, and passive diffusion.


Figures
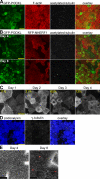
Figure 1.
Figure 1.
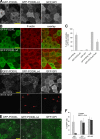
Podocalyxin is excluded from the CMD before emergence of a cilium. (A) MDCK cells expressing GFP-PODXL were grown on filters for 8 d and were fixed and stained with antiacetylated tubulin to visualize primary cilia and phalloidin to visualize F-actin. Bar, 20 µm. (B) Cells expressing GFP-PODXL and RFP-NHERF1 were fixed and stained with antiacetylated tubulin 4 or 8 d after seeding on filters. GFP-PODXL and RFP-NHERF1 patterns are similar between days 4 and 8, but few cilia are present on day 4. Bar, 20 µm. (C) Live cells expressing GFP-PODXL were imaged and individually scored for the appearance of a GFP-PODXL exclusion zone in the center of the apical membrane. Three fields of cells were counted for each of two experiments, and the percentage of cells with apparent exclusion zones appears on each image. On day 1, only 16/150 cells appeared to have a GFP-PODXL exclusion zone. The fraction rose on day 2 (46/214) and dramatically increased on day 3 (166/257) before reaching a plateau on day 4 (182/250). Images were collected with identical microscope settings. Bar, 10 µm. (D) 24 h after seeding on a filter, cells were fixed and stained with anti–γ-tubulin to visualize centrioles and anti-gp135 to visualize endogenous podocalyxin. Centrioles are aligned below the center of the apical membrane before podocalyxin is excluded from the CMD. Small podocalyxin exclusion zones are only seen in fixed samples. Images represent a single confocal plane. Bar, 20 µm. (E) SEM imaging of cells 4 d after seeding surprisingly shows microvilli in the CMD. After 8 d, an area at the base of primary cilia (arrowheads) is free of microvilli. Images in A–C are projected z stacks. Bars: (left) 5 µm; (right) 2 µm.
Figure 2.
Figure 2.
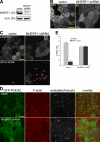
GFP-PODXLΔ4 and GFP-GPI are found in the CMD and cilia of live MDCK cells, but fixation can create the appearance of CMD exclusion. (A) Live cells expressing GFP-PODXLΔ4 or GFP-GPI were imaged 4 d after seeding and, in contrast to GFP-PODXL, failed to show exclusion from the CMD. Images were collected with microscope settings identical to Fig. 1 C. GFP-PODXL day 4 image from Fig. 1 C is shown for comparison. (B) Paraformaldehyde-fixed cells expressing GFP-PODXL (top row) or GFP-PODXLΔ4 (bottom row) were stained with phalloidin 4 d after seeding. GFP-PODXLΔ4 appeared to be excluded from the CMD in many cells. (C) Cells expressing GFP-PODXL, GFP-PODXLΔ4, or GFP-GPI were imaged and individually scored for the appearance of an exclusion zone. In live cells, GFP-PODXL was excluded from the CMD in 182/250 cells scored, in contrast to GFP-PODXLΔ4 (5/276) and GFP-GPI (11/269). In fixed cells, GFP-PODXL was still excluded from the CMD in most cells (209/243), but the fraction of cells that also excluded GFP-PODXLΔ4 increased from <5 to 40% (82/204). (D) Images of live cells 12 d after seeding on filters show that GFP-PODXLΔ4 and GFP-GPI are present in both the CMD and ciliary membrane. (top row) Z stacks of the apical membrane of live cells expressing GFP-PODXL, GFP-PODXLΔ4, or GFP-GPI were projected into a single image. Images were collected with identical microscope settings to Fig. 1 C, but at lower digital zoom. (bottom row) Single confocal sections above the apical membrane were taken from the z stacks in the top row, and image brightness was increased. Visible cilia are labeled with arrowheads. (E) Cells expressing GFP-PODXL, GFP-PODXLΔ4, or GFP-GPI (green) were fixed and stained with antiacetylated tubulin (white) to image primary cilia 12 d after seeding on filters. (F) Cilia longer than 2 µm extending from GFP-positive cells were counted in five fields in each of two experiments. In fixed cells, cilia were identified by antiacetylated tubulin (ciliated); in live cells, cilia were identified as GFP-positive projections from the center of the apical membrane (GFP + cilium). Scoring GFP-PODXL–expressing cells, 54/188 fixed cells were ciliated, but only 4/144 live cells had a GFP-positive cilium. In contrast, GFP-PODXLΔ4–expressing cells had similar numbers of cilia that could be detected using the two methods (24/77 fixed and 34/126 live), as did GFP-GPI–expressing cells (77/219 fixed and 64/194 live). Images in A, B, and E are projections of z stacks. Error bars represent standard deviation between experiments. Bars, 10 µm.
Figure 3.
Figure 3.
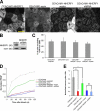
CMD exclusion of GFP-PODXL is dependent on NHERF1. (A) NHERF1 was knocked down in GFP-PODXL cells (NHERF1 shRNA) using a retroviral shRNA system. Control cells expressing GFP-PODXL (vector) were retrovirally transduced with a puromycin resistance plasmid without an shRNA sequence. Cell lysates were blotted with anti-NHERF1 and antiezrin antibodies. Molecular mass is indicated in kilodaltons. (B) Live imaging of cells 4 d after seeding revealed that control cells (vector) exclude GFP-PODXL from the CMD but NHERF1 shRNA cells do not. Exclusion was quantified as in Fig. 1 C, and the percentage of cells excluding GFP-PODXL from the CMD appears on each image. 148/230 control cells (vector) excluded GFP-PODXL from the CMD, whereas very few cells expressing NHERF1 shRNA (8/186) excluded GFP-PODXL. Images were collected with identical microscope settings to Fig. 1 C. (C) Knocking down NHERF1 allowed GFP-PODXL to enter primary cilia. Cells were imaged live 12 d after seeding on filters. (top row) Z stacks of the apical membrane of control (vector) or NHERF1 shRNA live cells expressing GFP-PODXL were projected into a single image. Images were collected with identical microscope settings to Fig. 1 C, but at lower digital zoom. (bottom row) Single confocal sections above the apical membrane were taken from the z stacks in the top row, and image brightness was increased. Visible cilia are labeled with arrowheads. (D) 12 d after seeding, NHERF1 shRNA and control cells (vector) were fixed and stained with phalloidin and antiacetylated tubulin. GFP-PODXL is found in the CMD of NHERF1 shRNA cells, but actin is still excluded from the CMD, and primary cilia appear to grow normally. (E) 100/214 control cells (vector) had a cilium detected by antiacetylated tubulin after fixation, whereas only 15/208 live cells had a GFP-PODXL–positive cilium. After NHERF1 knockdown, similar numbers of cilia could be detected using each method (74/194 fixed and 57/145 live). Images in B and D are projections of z stacks. Error bars represent standard deviation between experiments. Bars, 10 µm.
Figure 4.
Figure 4.
GFP-PODXL mobility is increased by PDZ-binding motif deletion or NHERF1 knockdown. (A) FRAP measurements on cells 4 d after seeding show that the lateral mobility of GFP-PODXL was increased either by deletion of the last four amino acids of its cytoplasmic tail (GFP-PODXLΔ4) or by knockdown of NHERF1 (NHERF1 shRNA). GFP-GPI is thought to freely diffuse in the membrane and recovers faster than the GFP-PODXL constructs. (B) FRAP measurements taken 120 s after photobleaching show a significant difference in FRAP between GFP-PODXL and GFP-PODXLΔ4 (P < 0.005). A similar difference was found between FRAP of GFP-PODXL after shRNA knockdown of NHERF1 and vector controls (P < 0.005). Values are means of FRAP measurements from 10 cells for GFP-GPI, GFP-PODXL, GFP-PODXLΔ4, and GFP-GPI and 8 cells for vector and NHERF1 shRNA. Error bars represent standard deviation between measurements.
Figure 5.
Figure 5.
CEACAM1 can be excluded from the CMD by adding tails from NHERF1-binding proteins. (A) GFP-CEACAM1–based constructs differ in their exclusion from the CMD 4 d after seeding. Images were collected with identical microscope settings to Fig. 1 C. (B) Cells were scored for GFP exclusion from the CMD as in Fig. 1 C. Only 5/169 cells appeared to exclude GFP-CEACAM1 from the CMD, and GFP-CEACAM1-DTHL (13/135), GFP-CEACAM1-PODXLΔ4 (10/237), and GFP-CEACAM1-CFTRΔ4 (12/148) were similar, whereas GFP-CEACAM1-PODXL (146/253) and GFP-CEACAM1-CFTR (94/111) were excluded from the CMD in most cells. (C) FRAP measurements indicated that GFP-CEACAM1 constructs that were excluded from the CMD were also less mobile in the apical membrane. (D) There was no significant difference between FRAP measurements of GFP-CEACAM1 and GFP-CEACAM1-DTHL after 120 s; however, there were significant differences between GFP-CEACAM1-PODXL and GFP-CEACAM1-PODXLΔ4, GFP-CEACAM1-CFTR and GFP-CEACAM1-CFTRΔ4, and GFP-CEACAM1-CBP and GFP-CEACAM1-CBPΔ4 (P < 0.005). (C and D) Each FRAP value is a mean of measurements from eight cells. Error bars represent standard deviation between measurements. (E) Cells expressing GFP constructs were grown on tissue culture plates and lysed when confluent. GFP constructs were immunoprecipitated from cell lysates, eluted, and Western blotted. Membranes were probed with anti-NHERF1 and either anti-GFP or anti-gp135 antibodies. The arrow to the left of the podocalyxin blot points to the GFP-PODXL band; the large band below is endogenous podocalyxin. GFP-PODXL and GFP-PODXLΔ4 lysate lanes represent 2% of the lysate used in the IP, and CEACAM1 lysate blots represent 1% of the lysate used in the IP. Molecular mass is indicated in kilodaltons. (F) Cells expressing high levels of GFP-CEACAM1-PODXL or GFP-CEACAM1-PODXLΔ4 were grown on filters for 4 d, methanol fixed, and stained for endogenous podocalyxin with anti-gp135 antibody. Podocalyxin did not appear to be excluded from the CMD in cells expressing GFP-CEACAM1-PODXL, whereas podocalyxin distribution was unaffected by expression of GFP-CEACAM1-PODXLΔ4. (G) CMD exclusion of endogenous podocalyxin was scored in cells expressing high levels of GFP-CEACAM1-PODXL or GFP-CEACAM1-PODXLΔ4 and in neighboring cells not expressing a GFP construct. Only 34/197 cells expressing GFP-CEACAM1-PODXL appeared to be excluding endogenous podocalyxin from the CMD, whereas 131/143 neighboring cells were excluding podocalyxin. The fraction of cells excluding podocalyxin was similar between those expressing GFP-CEACAM1-PODXLΔ4 (119/143) and neighbors (128/149). Images are projections of z stacks. Error bars represent standard deviation between experiments, except in D. Bars, 10 µm.
Figure 6.
Figure 6.
CEACAM1 can be excluded from the CMD independently of NHERF1 by adding domains that bind more directly to the cytoskeleton. (A) Addition of NHERF1’s ERM-binding domain or ezrin’s actin-binding domain is sufficient to exclude GFP-CEACAM1 from the CMD 4 d after seeding. NHERF1 was knocked down in GFP-CEACAM1-NHERF1 cells (GFP-CEACAM1-NHERF1 shRNA), and exclusion was similar to control cells (GFP-CEACAM1-NHERF1 vector). Images were collected with identical microscope settings to Fig. 1 C. (B) GFP-CEACAM1-NHERF1 shRNA and GFP-CEACAM1-NHERF1 vector cell lysates were blotted with anti-NHERF1 and antiezrin antibodies. Molecular mass is indicated in kilodaltons. (C) Cells were scored for GFP exclusion from the CMD as in Fig. 1 C. 113/199 cells expressing GFP-CEACAM1-NHERF1 appeared to exclude the construct from the CMD, and similar results were seen for GFP-CEACAM1-ezrin (105/185). After shRNA knockdown of NHERF1, GFP-CEACAM1-NHERF1 was excluded from the CMD in 193/393 cells, a similar ratio to cells only treated with vector (125/232). Error bars represent standard deviation between experiments. (D) FRAP measurements indicated that GFP-CEACAM1 was less mobile in the apical membrane after addition of an ERM- or actin-binding domain, and this was independent of NHERF1 knockdown. (E) There are significant differences in the FRAP measurements between GFP-CEACAM1 and both GFP-CEACAM1-NHERF1 (**, P < 0.005) and GFP-CEACAM1-ezrin (*, P < 0.05) after 120 s. No significant difference was seen in the FRAP of GFP-CEACAM1-NHERF1 after shRNA knockdown of NHERF1. GFP-CEACAM1 data are from Fig. 5 and are included as a reference. (D and E) Each FRAP value is a mean of measurements from eight cells. Error bars represent standard deviation between measurements. Images are projections of z stacks. Bars, 10 µm.
Figure 7.
Figure 7.
Smo can be retained outside the CMD by association with the retention matrix. Live cells expressing GFP-Smo-NHERF1-FR or GFP-Smo-NHERF1 were labeled with Alexa Fluor 647 anti-GFP on the apical side (surface label). (A) XY projections of cells expressing the ERM binding–deficient GFP-Smo-NHERF1-FR exhibit bright spots corresponding to cilia. Pairs of spots are concentrations of GFP at the base and tip of a single cilium. In contrast, Smo fused to a NHERF1 domain capable of binding ERMs (GFP-Smo-NHERF1) was localized over the entire apical plasma membrane outside the CMD. Bar, 10 µm. (B) XZ sections of cells expressing GFP-Smo-NHERF1-FR reveal cilia with an uneven distribution of GFP. Surface labeling shows GFP-Smo-NHERF1 across the apical membrane. Image brightness was increased in B. Bar, 5 µm.
Figure 8.
Figure 8.
GFP-CEACAM1 is concentrated in the primary cilium after addition of a microtubule-binding domain. (A) Live cells expressing GFP-CEACAM1-tau were imaged 4 d after seeding. The image is a projection of a z stack and was collected with identical microscope settings to Fig. 1 C. Bar, 10 µm. (B) FRAP measurements of GFP-CEACAM1-tau 4 d after seeding show mobility similar to GFP-CEACAM1. GFP-CEACAM1 data are from Fig. 5 and are included as a reference. Each FRAP value is a mean of measurements from eight cells. Error bars represent standard deviation between measurements. (C) XZ sections of cells 12 d after seeding show GFP-CEACAM1-tau enriched in the cilium relative to the apical membrane, whereas GFP-CEACAM1 is evenly distributed. Bar, 3 µm.

References

    1. Balcarova-Ständer J., Pfeiffer S.E., Fuller S.D., Simons K. 1984. Development of cell surface polarity in the epithelial Madin-Darby canine kidney (MDCK) cell line. EMBO J. 3:2687–2694 - PMC - PubMed
    1. Barton G.M., Medzhitov R. 2002. Retroviral delivery of small interfering RNA into primary cells. Proc. Natl. Acad. Sci. USA. 99:14943–14945 10.1073/pnas.242594499 - DOI - PMC - PubMed
    1. Berbari N.F., Johnson A.D., Lewis J.S., Askwith C.C., Mykytyn K. 2008. Identification of ciliary localization sequences within the third intracellular loop of G protein-coupled receptors. Mol. Biol. Cell. 19:1540–1547 10.1091/mbc.E07-09-0942 - DOI - PMC - PubMed
    1. Bershteyn M., Atwood S.X., Woo W.M., Li M., Oro A.E. 2010. MIM and cortactin antagonism regulates ciliogenesis and hedgehog signaling. Dev. Cell. 19:270–283 10.1016/j.devcel.2010.07.009 - DOI - PMC - PubMed
    1. Brdicková N., Brdicka T., Andera L., Spicka J., Angelisová P., Milgram S.L., Horejsí V. 2001. Interaction between two adapter proteins, PAG and EBP50: a possible link between membrane rafts and actin cytoskeleton. FEBS Lett. 507:133–136 10.1016/S0014-5793(01)02955-6 - DOI - PubMed

Substances