. 2011 Apr 12;108(15):5980-5.
doi: 10.1073/pnas.1009932108. Epub 2011 Mar 28.

Calcium-dependent copper redistributions in neuronal cells revealed by a fluorescent copper sensor and X-ray fluorescence microscopy

Affiliations

Calcium-dependent copper redistributions in neuronal cells revealed by a fluorescent copper sensor and X-ray fluorescence microscopy

Sheel C Dodani et al. Proc Natl Acad Sci U S A. .

Abstract

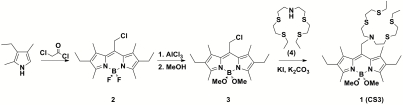
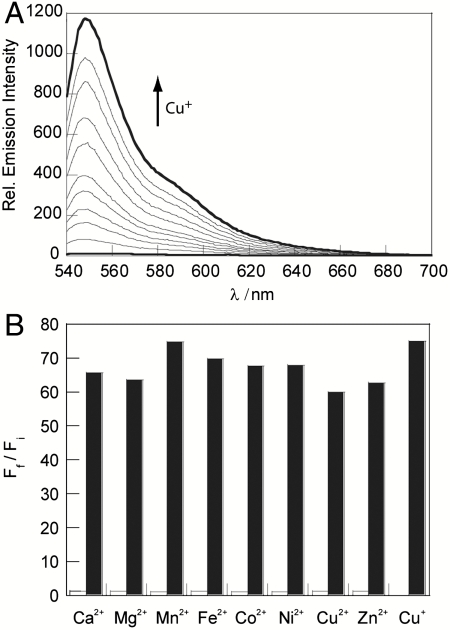
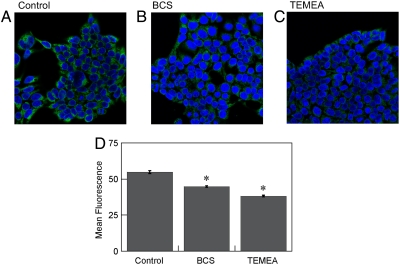
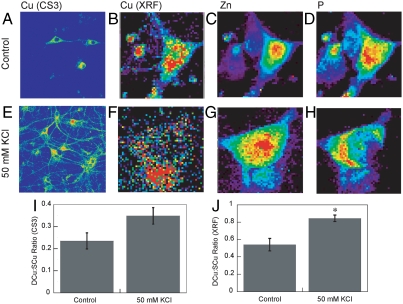
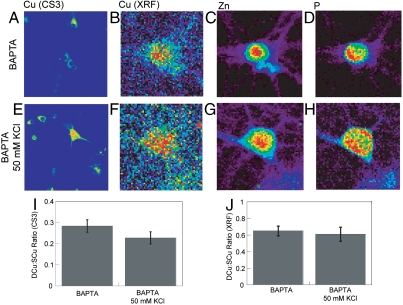
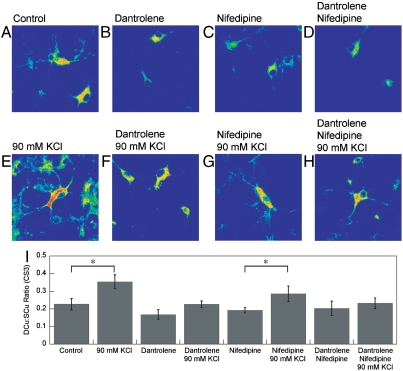
Dynamic fluxes of s-block metals like potassium, sodium, and calcium are of broad importance in cell signaling. In contrast, the concept of mobile transition metals triggered by cell activation remains insufficiently explored, in large part because metals like copper and iron are typically studied as static cellular nutrients and there are a lack of direct, selective methods for monitoring their distributions in living cells. To help meet this need, we now report Coppersensor-3 (CS3), a bright small-molecule fluorescent probe that offers the unique capability to image labile copper pools in living cells at endogenous, basal levels. We use this chemical tool in conjunction with synchotron-based microprobe X-ray fluorescence microscopy (XRFM) to discover that neuronal cells move significant pools of copper from their cell bodies to peripheral processes upon their activation. Moreover, further CS3 and XRFM imaging experiments show that these dynamic copper redistributions are dependent on calcium release, establishing a link between mobile copper and major cell signaling pathways. By providing a small-molecule fluorophore that is selective and sensitive enough to image labile copper pools in living cells under basal conditions, CS3 opens opportunities for discovering and elucidating functions of copper in living systems.


Conflict of interest statement

The authors declare no conflict of interest.

Figures

Fig. 1.
Fig. 1.
Synthesis of CS3.
Fig. 2.
Fig. 2.
Spectroscopic responses and selectivity of CS3. All spectra were acquired in 20 mM HEPES, pH 7, at 25 °C. (A) Fluorescence response of 4 μM CS3 to Cu+. Spectra shown are for buffered [Cu+] of 0, 0.3, 0.5, 0.8, 1.0, 1.5, 2.0, 2.5, 3.0, 3.5, and 4.0 μM. (B) Fluorescence responses of CS3 to various metal ions. Bars represent the final integrated fluorescence response (Ff) over the initial integrated emission (Fi). White bars represent the addition of an excess of the appropriate metal ion (2 mM for Ca2+, Mg2+, and Zn2+; 50 μM for all other cations) to a 4 μM solution of CS3. Black bars represent the subsequent addition of 4 μM Cu+ to the solution. Excitation was provided at 530 nm, and the collected emission was integrated over 540 to 700 nm.
Fig. 3.
Fig. 3.
Molecular imaging of endogenous basal Cu in HEK 293T cells with CS3. (A) Control HEK 293T cells, (B) HEK 293T cells supplemented with 200 μM BCS in the growth medium for 20 h at 37 °C, and (C) HEK 293T cells treated with 100 μM TEMEA for 10 min. A, B, and C were stained with 2 μM CS3, 5 μM Hoechst 33342, and DMSO vehicle for TEMEA for 10 min at 37 °C in DMEM. (D) Graph showing the quantification of mean fluorescence intensity of each condition normalized to the control condition (n = 5 fields of cells per condition). Error bars represent the SEM. Asterisk (*) indicates P < 0.01 compared to control cells.
Fig. 4.
Fig. 4.
Molecular imaging of Cu distributions in resting and depolarized rat hippocampal neurons with CS3 and XRFM. (A) Live primary rat hippocampal neurons treated with extracellular solution (ECS) buffer for 2 min and then stained with 2 μM CS3 for 10 min. (BD) Rat hippocampal neurons treated with ECS buffer for 2 min, fixed with 4% PFA and imaged by XRFM. Images shown are for (B) Cu, (C) Zn, and (D) P channels. (E) Live primary rat hippocampal neurons treated with 50 mM KCl in ECS buffer for 2 min and then stained with 2 μM CS3 for 10 min. (FH) Rat hippocampal neurons treated with 50 mM KCl in ECS buffer for 2 min and then fixed with 4% PFA and imaged by XRFM. Images shown are for (F) Cu, (G) Zn, and (H) P channels. (I) Graph showing the blinded quantification of CS3-derived dendrite:soma fluorescence ratios for resting and depolarized neurons (n = 18). Error bars represent SEM (P = 0.09). (J) Graph showing the XRF dendrite:soma fluorescence ratios for resting and depolarized neurons. Error bars represent SEM. Asterisk (*) indicates P < 0.05.
Fig. 5.
Fig. 5.
(A) Rat hippocampal neurons treated with ECS buffer for 2 min with 10 μM BAPTA-AM and then stained with 2 μM CS3 for 10 min. (BD) Rat hippocampal neurons treated with ECS buffer with 10 μM BAPTA-AM for 2 min and then fixed with 4% PFA and imaged by XRFM. Images shown are for (B) Cu, (C) Zn, and (D) P channels. (E) Live primary rat hippocampal neurons treated with 50 mM KCl in ECS buffer with 10 μM BAPTA-AM for 2 min and then stained with 2 μM CS3 for 10 min. (FH) Rat hippocampal neurons treated with 50 mM KCl in ECS buffer with 10 μM BAPTA-AM for 2 min and then fixed with 4% PFA and imaged by XRFM. Images shown are for (F) Cu, (G) Zn and (H) P channels. (I) Graph showing the blinded quantification of CS3-derived dendrite:soma fluorescence ratios for BAPTA-AM–treated (n = 22) and BAPTA-AM/KCl–treated (n = 16) neurons. Error bars represent SEM. (J) Graph showing the XRF dendrite:soma fluorescence ratios for resting and depolarized BAPTA-AM–treated neurons. Error bars represent SEM.
Fig. 6.
Fig. 6.
Molecular imaging of Cu distributions in resting, depolarized, and inhibitor-treated rat hippocampal neurons with CS3. (A) Live primary rat hippocampal neurons treated with ECS buffer for 10 min, (B) treated with ECS buffer with 30 μM dantrolene for 10 min, (C) treated with ECS buffer with 100 μM nifedipine for 10 min, (D) treated with ECS buffer with 30 μM dantrolene and 100 μM nifedipine for 10 min, (E) treated with 90 mM KCl in ECS buffer for 2 min, (F) treated with 30 μM dantrolene in ECS buffer for 10 min and then 90 mM KCl in ECS buffer for 2 min, (G) treated with 100 μM nifedipine in ECS buffer for 10 min and then 90 mM KCl in ECS buffer for 2 min, and (H) treated with 30 μM nifedipine and 100 μM dantrolene in ECS buffer for 10 min and then 90 mM KCl in ECS buffer for 2 min and then stained with 2 μM CS3 for 10 min. (I) Graph showing the blinded quantification of CS3-derived dendrite:soma fluorescence ratios for resting, depolarized, and inhibitor-treated neurons (n≥11). Error bars respresent the SEM. Asterisk (*) indicates P < 0.05.

References

    1. Tsien RW, Tsien RY. Calcium channels, stores, and oscillations. Annu Rev Cell Biol. 1990;6:715–760. - PubMed
    1. Debanne D. Information processing in the axon. Nat Rev Neurosci. 2004;5:304–316. - PubMed
    1. Clapham DE. Calcium signaling. Cell. 2007;131:1047–1058. - PubMed
    1. Lippard SJ, Berg JM. Principles of Bioinorganic Chemistry. Mill Valley, CA: University Science Books; 1994.
    1. Gray HB, Stiefel EI, Valentine JS, Bertini I. Biological Inorganic Chemistry. Mill Valley, CA: University Science Books; 2007.

Publication types