. 2011 Apr 12;108(15):6044-9.
doi: 10.1073/pnas.0914274108. Epub 2011 Mar 28.

Rapid, global demographic expansions after the origins of agriculture

Affiliations

Rapid, global demographic expansions after the origins of agriculture

Christopher R Gignoux et al. Proc Natl Acad Sci U S A. .

Abstract

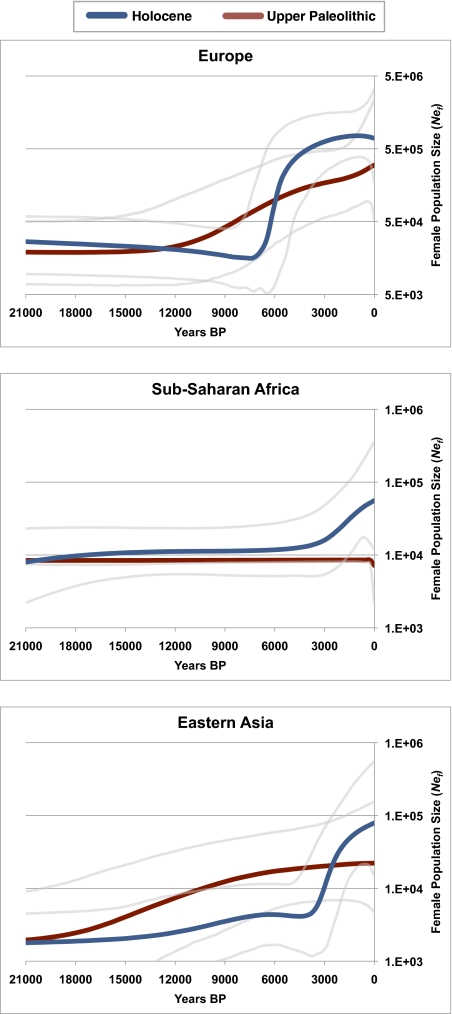
The invention of agriculture is widely assumed to have driven recent human population growth. However, direct genetic evidence for population growth after independent agricultural origins has been elusive. We estimated population sizes through time from a set of globally distributed whole mitochondrial genomes, after separating lineages associated with agricultural populations from those associated with hunter-gatherers. The coalescent-based analysis revealed strong evidence for distinct demographic expansions in Europe, southeastern Asia, and sub-Saharan Africa within the past 10,000 y. Estimates of the timing of population growth based on genetic data correspond neatly to dates for the initial origins of agriculture derived from archaeological evidence. Comparisons of rates of population growth through time reveal that the invention of agriculture facilitated a fivefold increase in population growth relative to more ancient expansions of hunter-gatherers.


Conflict of interest statement

The authors declare no conflict of interest.

Figures

Fig. 1.
Fig. 1.
Bayesian Skyline plots showing estimates of the effective size of the female population through time, given mtDNA lineages from both the Holocene and Upper Paleolithic: European Holocene and Upper Paleolithic population size curves (Top), sub-Saharan African Holocene and Upper Paleolithic population size curves (Middle), Southeastern Asia Holocene and Papua New Guinea Upper Paleolithic population size curves (Bottom). For each point in time, the median female population effective size is plotted along with the 95% confidence intervals. Because each set of lineages represents a fraction of the lineages present in each region, size estimates are also only a fraction of the actual population size. Y axes are adjusted for clarity. The x axis represents time in years. Skyline curves were independently corrected for the time dependency of mtDNA mutation rate estimates to accurately compare the timing of genetic growth estimates and archaeological dates for population events.
Fig. 2.
Fig. 2.
Map showing the rate of agricultural population growth for Europe interpolated via Kriging from archaeological data on the Neolithic incursion. (A) The dates of the initial Neolithic (agricultural) remains based on 665 calibrated radiocarbon archaeological sites from Pinhasi et al. (23). Units are in years. (B) The timing of each archaeological site was then paired with the appropriate population growth rate during the same time interval calculated from our European Neolithic Skyline analysis seen in Fig. 1 assuming a wavefront expansion. Darker colors indicate more rapid population growth; lighter colors indicate slower population growth. Initially, population growth in our European Holocene dataset was moderate. Only after agriculture diffused across the Mediterranean regions did population growth begin to accelerate (Fig. 2B).

References

    1. Diamond J, Bellwood P. Farmers and their languages: The first expansions. Science. 2003;300:597–603. - PubMed
    1. Haak W, et al. Ancient DNA from the first European farmers in 7500-year-old Neolithic sites. Science. 2005;310:1016–1018. - PubMed
    1. Bramanti B, et al. Genetic discontinuity between local hunter-gatherers and central Europe's first farmers. Science. 2009;326:137–140. - PubMed
    1. Chikhi L, Nichols RA, Barbujani G, Beaumont MA. Y genetic data support the Neolithic demic diffusion model. Proc Natl Acad Sci USA. 2002;99:11008–11013. - PMC - PubMed
    1. Dupanloup I, Bertorelle G, Chikhi L, Barbujani G. Estimating the impact of prehistoric admixture on the genome of Europeans. Mol Biol Evol. 2004;21:1361–1372. - PubMed

Publication types

Substances