. 2011 Jul;21(7):1088-101.
doi: 10.1038/cr.2011.56. Epub 2011 Mar 29.

Regulation of cellular senescence by the essential caveolar component PTRF/Cavin-1

Affiliations

Regulation of cellular senescence by the essential caveolar component PTRF/Cavin-1

Lin Bai et al. Cell Res. 2011 Jul.

Abstract

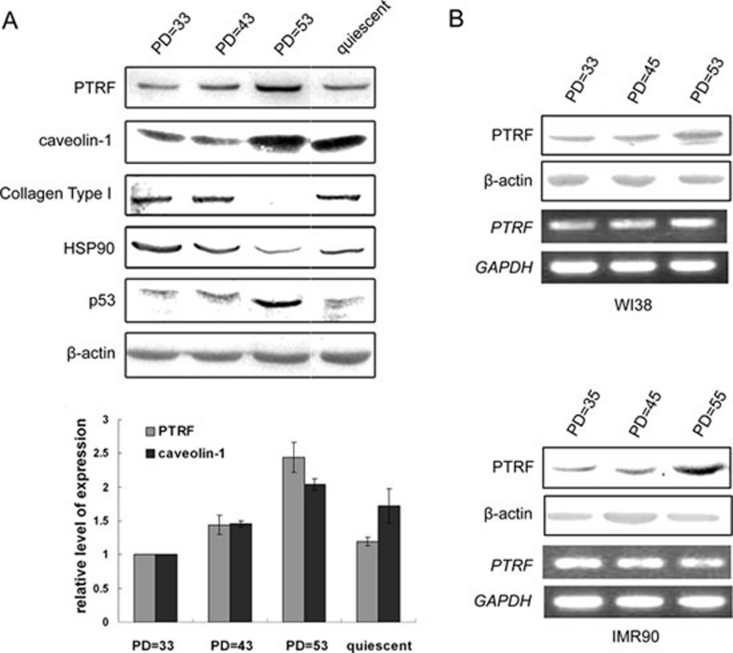
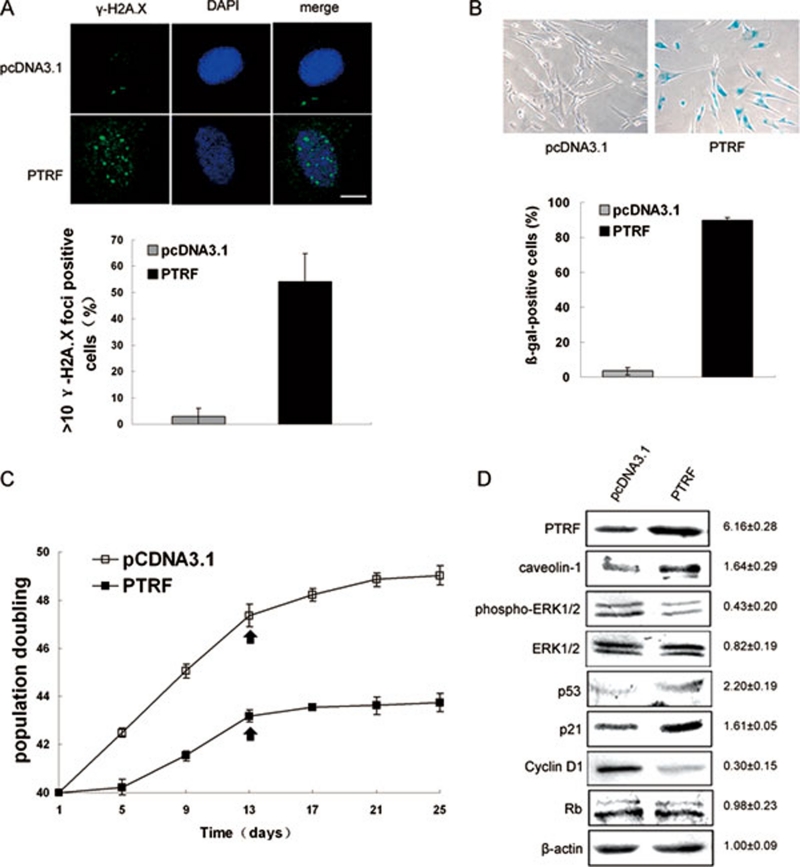
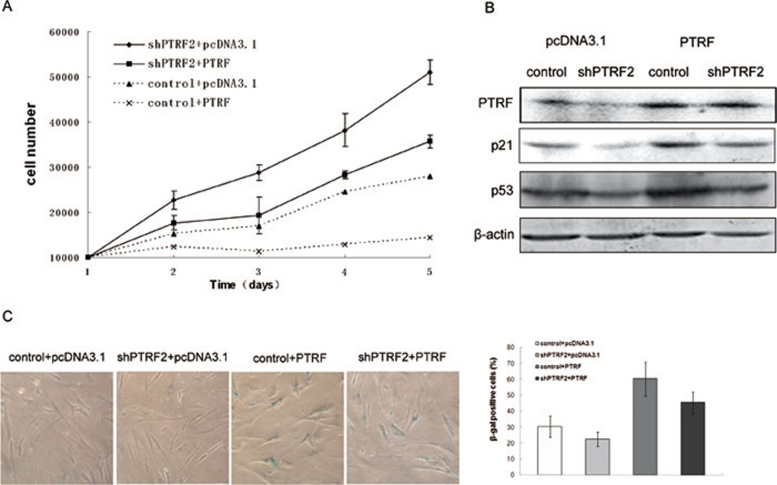
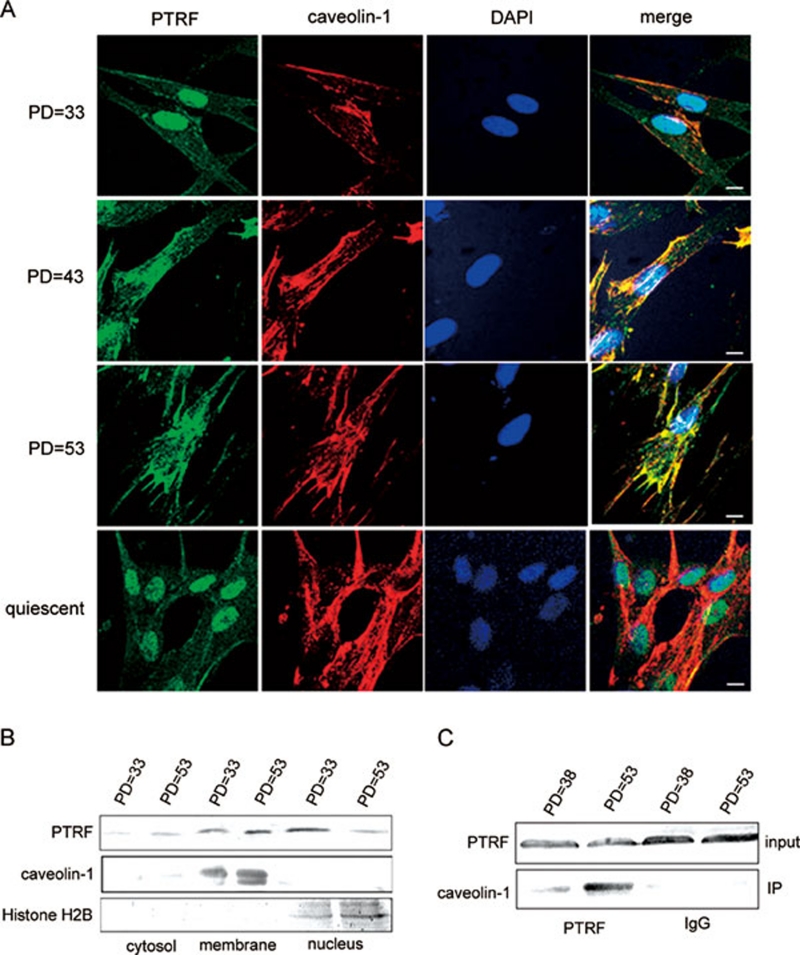
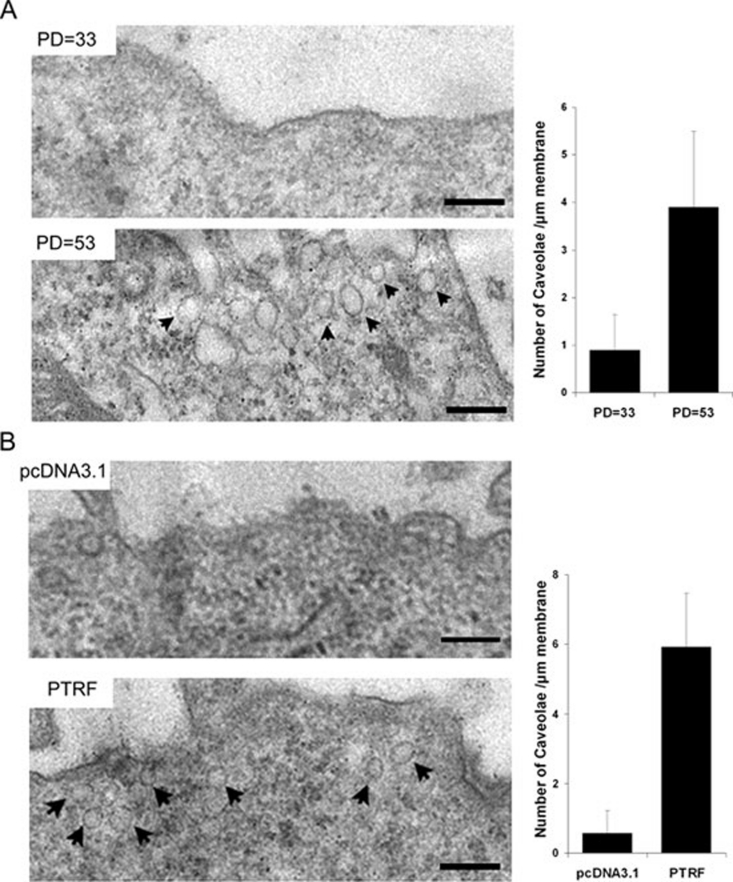
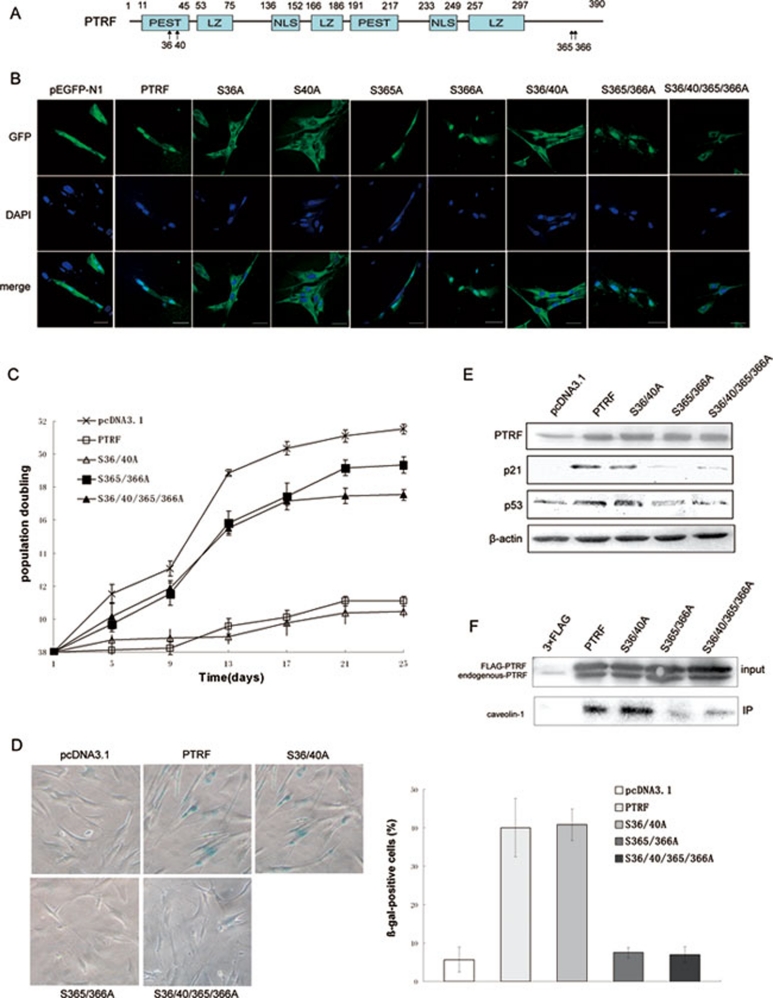
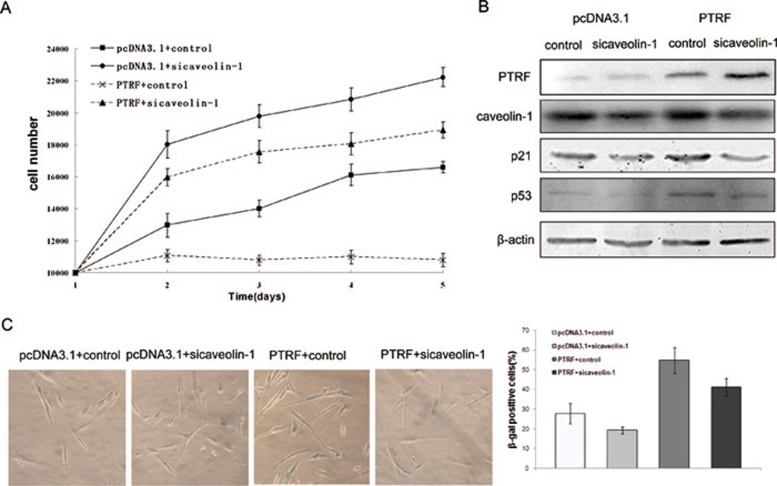
Polymerase I and transcript release factor (PTRF, also known as Cavin-1) is an essential component in the biogenesis and function of caveolae. Here, we show that PTRF expression is increased in senescent human fibroblasts. Importantly, overexpression of PTRF induced features characteristic of cellular senescence, whereas reduced PTRF expression extended the cellular replicative lifespan. Interestingly, we found that PTRF localized primarily to the nuclei of young and quiescent WI-38 human fibroblasts, but translocated to the cytosol and plasma membrane during cellular senescence. Furthermore, electron microscopic analysis demonstrated an increased number of caveolar structures in senescent and PTRF-transfected WI-38 cells. Our data suggest that the role of PTRF in cellular senescence is dependent on its targeting to caveolae and its interaction with caveolin-1, which appeared to be regulated by the phosphorylation of PTRF. Taken together, our findings identify PTRF as a novel regulator of cellular senescence that acts through the p53/p21 and caveolar pathways.


Figures

Figure 1
Figure 1
Upregulation of PTRF in senescent human fibroblasts. (A) Western blot analysis of PTRF and other senescence-associated proteins in young replicating, middle-aged replicating, replicatively senescent and young serum-starved quiescent WI-38 fibroblasts. The relative expression of PTRF and caveolin-1 is shown. (B) The expression of PTRF at the mRNA and protein levels during replicative senescence of WI-38 and IMR-90 fibroblasts was assayed by RT-PCR and western blot analysis, respectively. GAPDH and β-actin were used as loading controls.
Figure 2
Figure 2
Overexpression of PTRF induces phenotypes characteristic of cellular senescence. (A) Accumulation of γ-H2A.X induced by overexpression of PTRF. Cells were fixed and stained with antibodies against γ-H2A.X (green) and DAPI (blue). The γ-H2A.X staining showed DNA foci in the nuclei of pcDNA3.1-PTRF cells, which is characteristic of senescent cells. DAPI was used to stain the nuclei. The scale bar represents 10 μm. Quantification of cells with >10 γ-H2A.X is shown in the lower panel of (A). At least 200 cells were analyzed per experiment. A lower magnification image is shown in Supplementary information, Figure S1B. (B) SA-β-gal staining of senescent cells induced by overexpression of PTRF. The percentage of SA-β-gal-positive cells was calculated from three randomly chosen fields. The experiment was repeated three times, and the results are presented as mean ± s.d. (C) Growth curves of WI-38 cells that were stably transfected with pcDNA3.1 or pcDNA3.1-PTRF. Cumulative population doubling (PD) was calculated at each time point. The experiment was repeated three times, and the data shown represent the mean ± s.d. The arrows marked under the curve indicate the time points at which the γ-H2A.X staining assay (A) and the SA-β-gal staining assay (B) were performed. (D) Western blot analysis of PTRF, senescence-associated proteins and caveolae-related proteins in WI-38 cells that were transiently transfected with the pcDNA3.1 control vector, or pcDNA3.1-PTRF. A representative blot is shown. Fold changes of the protein levels in pcDNA3.1-PTRF-transfected cells compared to pcDNA3.1-transfected cells were determined densitometrically as the ratio (mean ± s.d.) from three independent experiments, and are indicated at the right side of the blot. Expression level of each given protein in pcDNA3.1-transfected cells was arbitrarily set at 1. β-actin was used for normalization.
Figure 3
Figure 3
shRNA-mediated knockdown of PTRF results in lifespan extension. WI-38 cells were stably transduced with the control retroviral or the shPTRF retroviral constructs. (A) Reduction of γ-H2A.X staining induced by shRNA-mediated knockdown of PTRF. Cells were fixed and stained with antibodies against γ-H2A.X (green) and DAPI (blue). DAPI was added to stain the nuclei. The scale bar represents 10 μm. Quantification of cells with > 10 γ-H2A.X is shown in the lower panel of (A). At least 200 cells were analyzed per experiment. A lower magnification image is shown in Supplementary information, Figure S1D. (B) SA-β-gal staining of senescent WI-38 cells transduced with the indicated shRNA. The percentage of cells with SA-β-gal-positive cells was calculated from three randomly chosen fields. The experiment was repeated three times, and the results represent the mean ± s.d. (C) Growth curves of WI-38 cells that were stably transfected with the indicated shRNA. Cumulative population doubling (PD) was calculated at each time point. The experiment was repeated three times, and data represent the mean ± s.d. The arrows marked under the curve indicate the time points at which γ-H2A.X staining (A) and SA-β-gal staining (B) were performed. (D) Western blot analysis of PTRF, senescence-associated proteins and caveolae-related proteins in control shRNA-transduced and shPTRF-transduced WI-38 cells. A representative blot is shown. Fold changes of the protein levels in shPTRF-transduced cells compared to control shRNA-transduced cells were determined densitometrically as the ratio (mean ± s.d) from three experiments and are indicated at the right side of the blot. The expression level of each given protein expression in control shRNA-transduced cells was arbitrarily set at 1. β-actin was used for normalization.
Figure 4
Figure 4
(A) Ectopic expression of PTRF reverses shPTFR-mediated lifespan extension in WI-38 cells. The WI-38-shPTRF2 stable cell line (PD = 43) was transiently transfected with pcDNA3.1 or pcDNA3.1-PTRF. Growth curves were generated by cell number at the indicated times. The data presented are from three independent experiments. (B) Western blot analysis of the cell lines in (A) to detect PTRF, p53 and p21 expression levels. β-actin was used as a loading control. (C) SA-β-gal staining of the cells indicated in (A). The percentage of SA-β-gal-positive cells was calculated from three randomly chosen fields. The experiment was repeated three times, and the results represent the mean ± s.d.
Figure 5
Figure 5
Subcellular distribution of PTRF in WI-38 cells at different growth stages. (A) Subcellular distribution of PTRF in young replicating (PD = 33), middle-aged replicating (PD = 43), replicatively senescent (PD = 53) and young quiescent WI38 fibroblasts. Cells were fixed, stained with antibodies against PTRF (green), caveolin-1 (red) and DAPI (blue), and visualized by laser-scanning confocal microscopy. The scale bar in (A) represents 10 μm. (B) Subcellular distribution of PTRF detected by western blot analysis of PTRF in cytosolic, membrane and nuclear fractions of young replicating and replicatively senescent WI-38 cells. The expression levels of caveolin-1 and histone H2B were used as markers for membrane and nuclear proteins, respectively. (C) Total cell lysates from young replicating and replicatively senescent WI-38 cells were immunoprecipitated with anti-PTRF and anti-IgG and immune complexes were analyzed by western blot using an anti-caveolin-1 antibody.
Figure 6
Figure 6
Increased numbers of caveolar structures in senescent and PTRF-transfected cells. (A) Electron micrographs of young (PD = 33) and senescent (PD = 53) WI-38 cells show an increased number of caveolae during cellular senescence. (B) PTRF-transfected WI-38 cells exhibited an increased number of caveolar structures (indicated by arrows). The number of caveolar structures was statistically analyzed in 10 independent cells. The scale bar represents 200 nm.
Figure 7
Figure 7
Analysis of serine phosphorylation sites on PTRF with respect to the subcellular distribution of PTRF and cellular senescence. (A) Schematic representation of the domain structure of PTRF protein: putative PEST domain (PEST), leucine zipper domain (LZ), nuclear localization signal (NLS). The numbers correspond to the first and last amino acids of each domain in the protein sequence. The previously identified phosphorylation sites, Ser36, Ser40, Ser365 and Ser366, are indicated by arrows . (B) WI-38 cells transfected with the indicated constructs were fixed and stained with DAPI to stain the nuclei. Cellular localization of wild-type pEGFP-N1-PTRF and the pEGFP-N1-PTRF mutants was determined by confocal microscopy. The scale bar represents 50 μm. (C) Growth curves of WI38 cells that were stably transfected with the indicated expression constructs. The data represent the means ± s.d of three independent experiments. (D) SA-β-gal staining of the cells indicated in (C). The percentage of SA-β-gal-positive cells was calculated from three randomly chosen fields. The experiment was repeated three times, and the results represent the mean ± s.d. (E) Western blot analysis of PTRF and the senescence-associated proteins p53 and p21 in WI-38 cells transfected with the indicated expression constructs. (F) The interaction of PTRF with caveolin-1 depends on the phosphorylation of PTRF at Ser365 and Ser366. HeLa cells were transiently transfected with the indicated constructs, and total cell lysates were subjected to western blot using anti-PTRF (input) or to immunoprecipitation with anti-FLAG antibody. Co-immunoprecipitated caveolin-1 was detected by western blot with anti-caveolin-1.
Figure 8
Figure 8
Caveolin-1 is involved in the process of PTRF-induced senescence. (A) WI-38 cells were co-transfected with the indicated constructs and siRNAs. Growth curves of these cell lines were generated by cell number at the indicated times. The data presented are from three independent experiments. (B) Western blot analysis of PTRF, caveolin-1, p53 and p21 expression in the cell lines in (A). (C) SA-β-gal staining of the cells indicated in (A). The percentage of SA-β-gal-positive cells was calculated from three randomly chosen fields. The experiment was repeated three times, and the results represent as the mean ± s.d.

Similar articles

Cited by

References

    1. Hayflick L. The limited in vitro lifetime of human diploid cell strains. Exp Cell Res. 1965;37:614–636. - PubMed
    1. Campisi J, d'Adda di Fagagna F. Cellular senescence: when bad things happen to good cells. Nat Rev Mol Cell Biol. 2007;8:729–740. - PubMed
    1. Ben-Porath I, Weinberg RA. When cells get stressed: an integrative view of cellular senescence. J Clin Invest. 2004;113:8–13. - PMC - PubMed
    1. Campisi J. Senescent cells, tumor suppression, and organismal aging: good citizens, bad neighbors. Cell. 2005;120:513–522. - PubMed
    1. Hayflick L. Theories of biological aging. Exp Gerontol. 1985;20:145–159. - PubMed

Publication types