. 2011 Mar 21;6(3):e17867.
doi: 10.1371/journal.pone.0017867.

A novel role of RASSF9 in maintaining epidermal homeostasis

Affiliations

A novel role of RASSF9 in maintaining epidermal homeostasis

Chiou-Mei Lee et al. PLoS One. .

Abstract

The physiological role of RASSF9, a member of the Ras-association domain family (RASSF), is currently unclear. Here, we report a mouse line in which an Epstein-Barr virus Latent Membrane Protein 1 (LMP1) transgene insertion has created a 7.2-kb chromosomal deletion, which abolished RASSF9 gene expression. The RASSF9-null mice exhibited interesting phenotypes that resembled human ageing, including growth retardation, short lifespan, less subcutaneous adipose layer and alopecia. In the wild-type mice, RASSF9 is predominantly expressed in the epidermal keratinocytes of skin, as determined by quantitative reverse-transcription PCR, immunofluorescence and in situ hybridization. In contrast, RASSF9-/- mice presented a dramatic change in epithelial organization of skin with increased proliferation and aberrant differentiation as detected by bromodeoxyuridine incorporation assays and immunofluorescence analyses. Furthermore, characteristic functions of RASSF9-/- versus wild type (WT) mouse primary keratinocytes showed significant proliferation linked to a reduction of p21Cip1 expression under growth or early differentiation conditions. Additionally, in RASSF9-/- keratinocytes there was a drastic down-modulation of terminal differentiation markers, which could be rescued by infection with a recombinant adenovirus, Adv/HA-RASSF9. Our results indicate a novel and significant role of RASSF9 in epidermal homeostasis.


Conflict of interest statement

Competing Interests: The authors have declared that no competing interests exist.

Figures

Figure 1
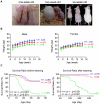
Figure 1. Characterization of the transgenic mutant mouse line.
(A) Macroscopic phenotypes of mice of various genotypes were shown at one, two, and six weeks after birth. (B) Growth curve analysis. The growth curves of the different genotypes exhibited an effect of haploinsufficiency on body weight. The body weight of the homozygous mutant was severely reduced as compared to that of the heterozygous and WT mice. (C) The survival rate. The survival rate of transgenic mutant mice was lower than that of the WT mice. Statistical analyses were performed using the SPSS13.0 software. P<0.05. +/+, wild type; +/−, heterozygous mutant; −/−, homozygous mutant.
Figure 2
Figure 2. Chromosomal disruption and RASSF9 gene silence in transgenic mutant line.
(A) Southern blot analysis. Genomic DNA samples from mice of various genotypes were separately digested with HindIII or EcoRI. The left panel showed that a single hybridization band was detected when the transgene was used as the probe. The right panel confirmed a deletion of the identified region in the homozygous mice, as determined by the lack of signal from a probe locating this region. (B) Physical map of the RASSF9 gene. The sequences flanking the inserted transgene in mutant mice were identified by positional cloning. Symbols: white box, RIF; gray box, H3F; black line, intronic DNA; dashed line, the region deleted by the insertional mutagenesis. (C) Total RNA extracted from the indicated tissues of mice of the WT and RASSF9−/− (−/−) genotypes (n = 3 per genotype) were analyzed by RT-PCR using RASSF9 and β-Actin gene-specific primers. β-Actin was used as the internal control for respective samples. The RT-PCR product was analyzed by 2% agarose gel electrophoresis. Similar results were obtained from two independent experiments in panel A. +/+, wild type; +/−, heterozygotes; −/−; homozygotes.
Figure 3
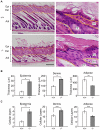
Figure 3. Histological abnormalities in RASSF9−/− skin.
(A) H&E staining of skin sections from two-week-old mice. The dashed yellow lines denote the epidermis-dermis and dermis-adipose borders. Similar results were obtained from three independent pairs of mice. The low and high magnification images were shown in the left and right panels, respectively. Left panel, scale bar  = 200 µm; Right panel, scale bar  = 20 µm. Epi, epidermis; Der, dermis; Adi, adipose; HF, hair follicle. (B, C) Quantitative analysis of the thickness and cellular layers of the epidermis, dermis and adipose tissues of histological skin sections from ten individual regions of each genotyping mouse at two weeks after birth. Values were measured by thickness and numbers of cellular layer in panel (B) and (C), respectively. Mean ± SD (n = 3, per genotype); * P<0.001, ** P<0.005, *** P<0.05. Panel A–C: +/+, wild type; +/−, heterozygotes; −/−, homozygotes.
Figure 4
Figure 4. Aberrant proliferation in RASSF9−/− skin.
(A) BrdU incorporation (green) and K14 (red) were co-stained by immunofluorescence in the skin cross-sections of two-week-old RASSF9−/− (−/−; right panel) and WT mice (+/+; left panel). Areas marked by yellow dashed line are enlarged in the adjacent column (“Enlarge”). Scale bar  = 100 µm. ORS, outer root sheath; HB, hair bulb. The abbreviations Epi, Derm, Adi were defined as described in Figure 3A. (B) High-magnification images of BrdU incorporation in dermal tissues. Abnormal patterns of proliferating cells in Epi, ORS and HB of −/− skin are consistent with those observed in (A). The dashed white lines denote the epidermis-dermis border. Similar results were obtained from three independent pairs of mice. Scale bar  = 20 µm. (C) Skin proliferation was evaluated by quantitation of BrdU incorporation using ImageJ software. Analyses were performed for the number of BrdU-positive nuclei in basal layer (top panel; per mm of epidermis); the number of BrdU-positive nuclei in dermal hair follicles (middle panel; per mm2 of dermis layer); and the percentage of HB with more than five BrdU-positive nuclei (bottom panel). Data represent scoring of at least 20 hair bulbs from each mouse and three mice for each genotype. *, P<0.05; **, P<0.001.
Figure 5
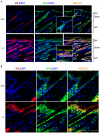
Figure 5. K6 is abnormally expressed in epidermis of RASSF9−/− skin.
(A) Frozen sections of skin from two-week-old mice were double-immunofluorescence stained for K6 (red) and K14 (green), with the merged signals in yellow. DAPI (blue) was used to for nuclear staining. Scale bar  = 100 µm. Similar results were obtained from three independent mice. +/+, wild type; −/−, RASSF9−/−. The other abbreviations of Epi, Derm, Adi were defined as described in Figure 3A. Areas outlined in white borders were enlarged for detailed views (insets). (B) High-magnification images of K6 and K14 expression, prepared as described above. Scale bar  = 20 µm.
Figure 6
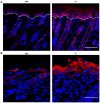
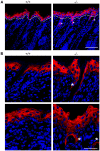
Figure 6. Aberrant differentiation in the skin of RASSF9−/− mice—K5 (red).
(A) Frozen sections of dorsal skins of WT (+/+) and RASSF9−/− (−/−) mice were immunostained with red fluorescence for K5 in 4-dpp mice. Scale bar  = 100 µm. (B) Images at higher magnification. Scale bar  = 40 µm. Blue, DAPI staining of cell nuclei.
Figure 7
Figure 7. Aberrant differentiation in the skin of RASSF9−/− mice—K14 (red).
(A) Frozen sections of dorsal skins of WT (+/+) and RASSF9−/− (−/−) mice were immunostained with red fluorescence for K14 in 4-dpp mice. The dashed white lines denote the epidermis-dermis border. Similar results were obtained from three independent pairs of mice. Scale bar  = 100 µm. (B) Images at higher magnification. Scale bar  = 40 µm. Blue, DAPI staining of cell nuclei.
Figure 8
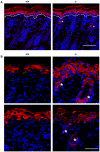
Figure 8. Aberrant differentiation in the skin of RASSF9−/− mice—K1 (red).
(A) Frozen sections of dorsal skins of WT (+/+) and RASSF9−/− (−/−) mice were immunostained with red fluorescence for K1 in 4-dpp mice. The dashed white lines denote the epidermis-dermis border. Similar results were obtained from three independent pairs of mice. Scale bar  = 100 µm. Note the abnormal staining of K1 expression of hair follicular cells (*) in dermis of RASSF9−/− skin. (B) Images at higher magnification, with follicular sites of abnormal K1 expression identified by asterisks (*) in both length-wise sections (top panels) and cross sections (bottom panels) of hair follicles. Scale bar  = 40 µm. Blue, DAPI staining of cell nuclei.
Figure 9
Figure 9. Aberrant differentiation in the skin of RASSF9−/− mice—K10 (red).
(A) Frozen sections of dorsal skins of WT (+/+) and RASSF9−/− (−/−) mice were immunostained with red fluorescence for K10 in 4-dpp mice. The dashed white lines denote the epidermis-dermis border. Similar results were obtained from three independent pairs of mice. Scale bar  = 100 µm. Note the abnormal staining of K10 expression of hair follicular epithelium (*) in dermis of RASSF9−/− skin. (B) Images at higher magnification, with follicular sites of abnormal K10 expression identified by asterisks (*) in both length-wise sections (top panels) and cross sections (bottom panels) of hair follicles. Both K1 and K10 are markers of early-stage keratinocyte differentiation, suggesting a delay in epidermal and follicular keratinocyte maturation. Scale bar  = 40 µm. Blue, DAPI staining of cell nuclei.
Figure 10
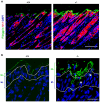
Figure 10. Aberrant differentiation in the skin of RASSF9−/− mice—filaggrin (green).
(A) Frozen sections of dorsal skins of RASSF9−/− and WT control mice were immunostained with green fluorescence for filaggrin and red fluorescence for K14 in two-week-old mice. Blue, DAPI staining of cell nuclei. Scale bar  = 100 µm. (B) Images of higher magnification for filaggrin staining (green fluorescence) in skin sections. The dashed white lines denote the epidermis-dermis border. Similar results were obtained from three independent pairs of mice. Scale bar  = 20 µm; GL, granular layer; KL, keratinocyte layer. Note the increased thickness and patchiness in layer of prominent filaggrin staining, as well as abnormal distribution of filaggrin staining in keratinocyte layer and hair follicle (*).
Figure 11
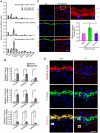
Figure 11. RASSF9 expression profiles in WT mouse.
(A) Quantitive RT-PCR analysis of RASSF9 mRNA expression in various tissues of WT mice at one and two weeks old. The results were normalized with regard to the mRNA expression of β-Actin (top panel), GAPDH (middle panel), or HPRT1 (bottom panel). Values represent the mean ± SD (one-week-old mice, n = 4; two-week-old mice, n = 5). (B) Quantitive RT-PCR analysis of RASSF9 (top panel), E-cadherin (CDH1) (middle panel), and fibronectin (fn1) (bottom panel) mRNA expression in the epidermis and dermis of the WT skin at 4-dpp old. The results were normalized to individual reference gene of β-Actin, GAPDH, or HPRT1 (the reference gene is specified at the bottom). The results were normalized with regard to the mRNA expression of β-Actin, GAPDH, or HPRT1. Values represent the mean ± SD (n = 4). *P<0.05, **P<0.001. (C) Frozen sections of 4-dpp skins were double-stained for RASSF9 (Red) and K1 (Green), with merged signals in yellow. “NC”, negative control, with no incubation in anti-RASSF9 anti-serum; immunostaining procedures for NC were otherwise identical to “anti-RASSF9” panels. Blue, DAPI staining of cell nuclei. Scale bar  = 100 µm. Area in white frame was enlarged to show the RASSF9 location in the WT skin (upper right panel). The relative intensity of RASSF9 in various epidermal layers of WT skin at 4-dpp were normalized to basal-layer signals (lower right panel). Data represent analyses by ImageJ of five individual images from each mouse (n = 3) and are presented as Mean ±SD fold intensity relative to basal layer. *, P<0.05. B, basal layer; S, suprabasal layer; G, granular layer. (D) Higher-magnification images of K1 (green) and RASSF9 (red) co-staining in frozen sections of dorsal skins of WT (+/+) and RASSF9−/− (−/−) mice. No RASSF9 signal was detected in RASSF9−/− epidermis. The dashed white lines denote the epidermis-dermis border. Similar results were obtained from three independent pairs of mice. Scale bar  = 20 µm. Epi, epidermis; Der, dermis.
Figure 12
Figure 12. RASSF9 affects keratinocyte proliferation and differentiation.
(A, B) RASSF9-mediated proliferation measured by BrdU incorporation using a Cell Proliferation Biotrak ELISA kit (Amersham) and BrdU immunofluorescence. The BrdU incorporation rate was normalized to the amount of input protein or nuclei. Values are shown as fold changes versus the control group or percentage of nuclei presented in top panel and bottom panel, respectively. (A) BrdU incoporation rate was performed in mouse primary keratinocytes after two-day incubation under growth medium. Mean ± SD (n = 3). *, P<0.05. (B) BrdU incoporation rate was evaluated from RASSF9−/− keratinocytes expressing HA-RASSF9 versus GFP control by adenoviral post transduction on 1 day and then subjected to growth medium for 2 days. Mean ± SD (n = 2). *, P<0.05. (C, D) The terminal differentiation of keratinocytes was analyzed by immunoblotting with specific antibodies against filaggrin and loricrin. K14 was used as loading control. Total cell extracts were prepared from mouse primary keratinocytes incubated for the indicated time under condition for growth (0.06 mM calcium) or differentiation (2 mM calcium). The intensity of protein expression was determined as the density of the relevant band normalized to that of the K14 loading control, as determined by ImageQuant 5.1. The resultant values were further normalized to baseline (lane 1 of same blotting) and shown below the images. Similar results were obtained from three independent experiments. (C) Primary RASSF9−/− and WT mouse keratinocytes incubated in the indicated medium for 4 days. (D) Primary RASSF9−/− keratinocytes transduced with Adv/HA-RASSF9 or a GFP-expressing control virus and then subjected to differentiation induction for 3 and 4 days. Panel B and D: +/+, wild type; −/−, RASSF9−/−.
Figure 13
Figure 13. The effect of RASSF9 on p21Cip1 expression in keratinocytes.
(A) RASSF9−/− and WT mouse keratinocytes were cultured in growth (0.06 mM calcium) and differentiation-inducing (2 mM calcium) medium for 2 days (left panel) and 4 days (right panel) prior to lysis and immunoblotting with the indicated antibody. K14-normalized intensity of p21Cip1 protein signal was determined by ImageJ software. The results were further normalized to baseline control (lane 1 of same blotting) and shown on the top of blot images. Mean ± SD (n = 3). *, P<0.05; +/+, wild type; −/−, RASSF9−/−. (B) Expression by transduction of HA-RASSF9 or GFP as negative control in RASSF9−/− cells under the growth condition (0.06 mM calcium) was examined for indicated time points. Immunoblotting and data analysis were performed as described in (A). Fold intensities relative to respective GFP controls are shown on the top of blot images. Mean ± SD (n = 2). *, P<0.05. (C) Re-expression of RASSF9 in RASSF9−/− cells under differentiation-inducing condition. Recombinant adenovirus infection, cell-lysate harvesting, immunoblotting and data analysis were performed as described in (B), except cells were subsequently incubated in 2 mM calcium medium for 2, 3 and 4 days on post transduction. Mean ± SD (n = 3).
Figure 14
Figure 14. Schematic model of RASSF9-mediated maintenance of epidermal homeostasis through p21Cip1 in keratinocyte growth and differentiation.
(A) In WT keratinocytes, RASSF9 expression is induced in cells progressing through early differentiation, but decreases thereafter as cells approach terminal differentiation. RASSF9 induces p21Cip1 expression in keratinocytes during growth and early differentiation, which may mediate in differentiation-related growth arrest. (B) A scheme illustrating that down-regulation of p21Cip1 expression, due to the loss of RASSF9 signaling in post-mitotic cells adjacent to the proliferation compartment, leads to the escape of keratinocytes from cell-cycle withdrawal and their subsequent proliferation.

References

    1. Sherwood V, Manbodh R, Sheppard C, Chalmers AD. RASSF7 is a member of a new family of RAS association domain-containing proteins and is required for completing mitosis. Mol Biol Cell. 2008;19:1772–1782. - PMC - PubMed
    1. Richter AM, Pfeifer GP, Dammann RH. The RASSF proteins in cancer; from epigenetic silencing to functional characterization. Biochim Biophys Acta. 2009;1796:114–128. - PubMed
    1. van der Weyden L, Adams DJ. The Ras-association domain family (RASSF) members and their role in human tumourigenesis. Biochim Biophys Acta. 2007;1776:58–85. - PMC - PubMed
    1. Hesson LB, Dunwell TL, Cooper WN, Catchpoole D, Brini AT, et al. The novel RASSF6 and RASSF10 candidate tumour suppressor genes are frequently epigenetically inactivated in childhood leukaemias. Mol Cancer. 2009;8:42. - PMC - PubMed
    1. Sherwood V, Recino A, Jeffries A, Ward A, Chalmers AD. The N-terminal RASSF family: a new group of Ras-association-domain-containing proteins, with emerging links to cancer formation. Biochem J. 2010;425:303–311. - PubMed

Publication types

Substances