. 2011 Mar 21;6(3):e17911.
doi: 10.1371/journal.pone.0017911.

GOBO: gene expression-based outcome for breast cancer online

Affiliations

GOBO: gene expression-based outcome for breast cancer online

Markus Ringnér et al. PLoS One. .

Abstract

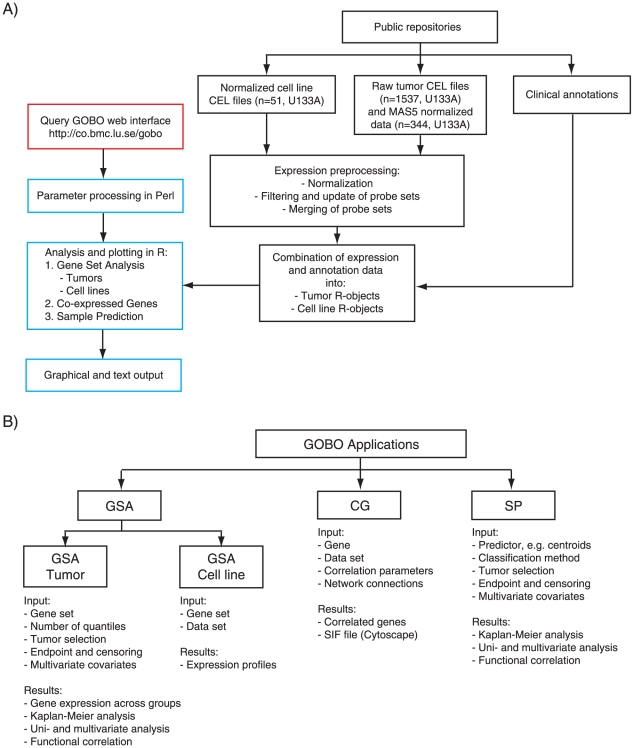
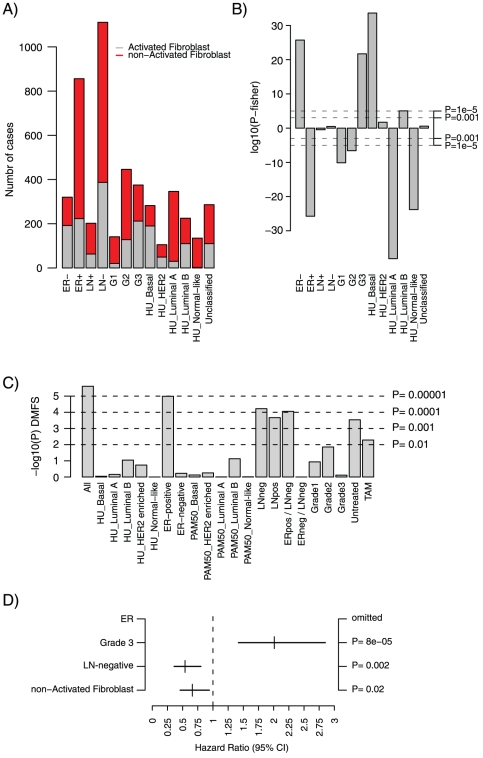
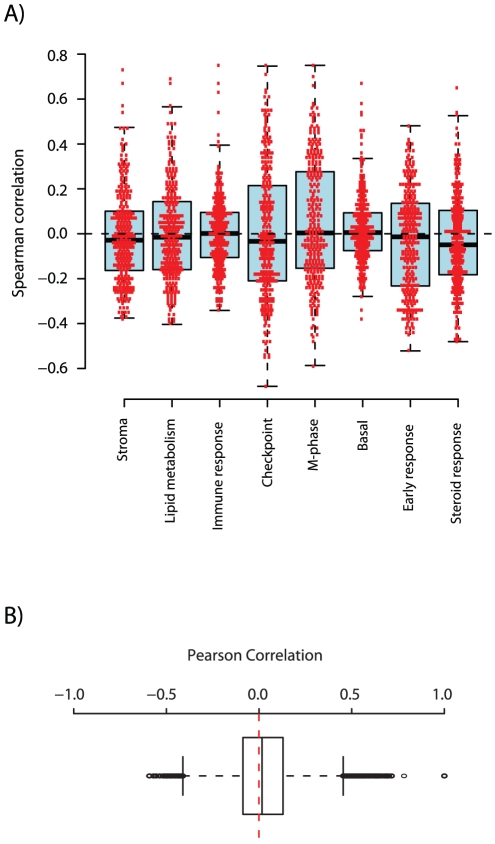
Microarray-based gene expression analysis holds promise of improving prognostication and treatment decisions for breast cancer patients. However, the heterogeneity of breast cancer emphasizes the need for validation of prognostic gene signatures in larger sample sets stratified into relevant subgroups. Here, we describe a multifunctional user-friendly online tool, GOBO (http://co.bmc.lu.se/gobo), allowing a range of different analyses to be performed in an 1881-sample breast tumor data set, and a 51-sample breast cancer cell line set, both generated on Affymetrix U133A microarrays. GOBO supports a wide range of applications including: 1) rapid assessment of gene expression levels in subgroups of breast tumors and cell lines, 2) identification of co-expressed genes for creation of potential metagenes, 3) association with outcome for gene expression levels of single genes, sets of genes, or gene signatures in multiple subgroups of the 1881-sample breast cancer data set. The design and implementation of GOBO facilitate easy incorporation of additional query functions and applications, as well as additional data sets irrespective of tumor type and array platform.


Conflict of interest statement

Competing Interests: The authors have declared that no competing interests exist.

Figures

Figure 1
Figure 1. Architecture of GOBO.
(A) Flowchart of the GOBO software illustrating the three different modules, data set module (black), web interface module (red) and analysis module (blue). (B) Layout of GOBO applications with respect to input and results generated.
Figure 2
Figure 2. GSA-Tumor analysis of CCNB1 using the 1881-sample breast cancer data set.
(A) Box plot of CCNB1 gene expression for tumor samples stratified according to PAM50 subtypes . (B) Box plot of CCNB1 gene expression for tumor samples stratified according to histological grade. (C) Association with outcome for CCNB1 gene expression levels in subgroups of breast cancer using DMFS as endpoint and 10-year censoring. Samples in the 1881-sample set were stratified into three quantiles based on CCNB1 expression, CCNB1_low (log2 expression −2.9 to −0.497), CCNB1_medium (−0.48 to 0.416), and CCNB1_high (0.42 to 2.8) followed by Kaplan-Meier survival analysis in 21 subgroups for 1379 cases with DMFS follow-up. Logrank P-values are shown as −log10(P-value). (D) Kaplan-Meier analysis, using DMFS as endpoint, for ER-positive tumors (n = 856) stratified into the three quantiles based on CCNB1 gene expression level. (E) Corresponding multivariate analysis for ER-positive tumors (n = 554) using lymph node status and stratified histological grade (histological grade 1 and 2 vs. 3) as covariates and DMFS as endpoint with 10-year censoring.
Figure 3
Figure 3. Result of GSA-Cell line analysis for CCNB1.
(A) Box plots of CCNB1 gene expression across cell lines grouped in the basal A (red), basal B (grey) and luminal (blue) subgroups . (B) Expression of CCNB1 across the 51 individual cell lines. Colours according to (a). (C) Box plot of gene expression for CCNB1 across cell lines grouped into clinical subtypes; triple negative (TN, red), HER2-positive (HER2, purple), and Hormone receptor-positive (HR, blue) based on annotation data from Neve et al. .
Figure 4
Figure 4. Identification of CCNB1 co-expressed genes and their association with outcome as a gene set.
(A) GOBO analysis using the Co-expressed genes application identified 34 genes to be highly correlated with CCNB1 in a 1751-sample subset of the full combined breast cancer data set (excluding Chin et al. cases). Iterative correlation analysis of the 35 genes showed that all genes were highly correlated to each other with at least 5 connections, as visualized by a Cytoscape V2.6.3 spring embedded network. Each connection is visualized as a line between two genes. CCNB1 is highlighted in yellow. (B) PAM clustering into two groups of samples using the Sample Predictor (SP) application with the 35 genes in (a), followed by Kaplan-Meier analysis for 21 subgroups of the 1881-tumor set using DMFS as endpoint and 10-year censoring for 1379 cases with DMFS follow-up. Logrank P-values are shown as −log10(P-value).
Figure 5
Figure 5. Sample Prediction analysis of the CSR gene signature in the 1881-sample breast cancer data set.
(A) Composition of CSR classification groups for different clinical variables and Hu et al. gene expression subtypes in the 1881-sample set. (B) Association of the CSR activated fibroblast classification group with clinical variables and gene expression subtypes (Hu et al.). Y-axis display log10(P-value) from Fisher tests for each category. E.g., for the basal-like subtype a 2×2 table is generated containing number of basal-like tumors in the CSR activated fibroblast class, number of non-basal-like tumors in the CSR activated fibroblast class, number of basal-like tumors in the CSR non-activated class and number of non-basal-like tumors in the CSR non-activated class. Fisher P-values from tests with odds ratios <1 (negative association) are depicted as log10(P) (negative values on y-axis), whereas odds ratios >1 (positive association) are depicted as –log10(P) (positive values on y-axis). Results can be interpreted such that the CSR activated fibroblast class is associated with ER-negative tumors, tumors with histological grade 3, and tumors classified as basal-like or luminal B. (C) Association with outcome for CSR classification in subgroups of breast cancer using DMFS as endpoint and 10-year censoring. Samples in the 1881-sample set were stratified into two groups based on correlation to the CSR activated fibroblast gene signature, followed by Kaplan-Meier survival analysis in 21 subgroups using 1379 cases with DMFS follow-up. Logrank P-values are shown as −log10(P-value). (D) Corresponding multivariate analysis for ER-positive tumors (n = 554) using lymph node status and stratified histological grade (histological grade 1 and 2 vs. 3) as covariates, DMFS as endpoint and 10-year censoring. ER status is omitted from the multivariate analysis since all investigated cases are ER-positive.
Figure 6
Figure 6. Correlation of genes in the CSR signature to different gene modules and pair wise co-expression.
(A) For each gene module and gene in the CSR centroid (n = 304 matching), a Spearman correlation value is computed by comparing the expression pattern across all samples for a specific gene to the corresponding rank sum for each sample in the specific module. Red dots indicate actual correlation values. (B) Box plot of pair wise correlations (n = 46056 pairs) of 304 genes from the CSR centroid matching in the 1751-sample set used by the CG application, showing that the absolute majority of genes in the CSR gene signature is not co-expressed across a large set of breast tumors.

References

    1. Perou CM, Sorlie T, Eisen MB, van de Rijn M, Jeffrey SS, et al. Molecular portraits of human breast tumours. Nature. 2000;406:747–752. - PubMed
    1. Sorlie T, Perou CM, Tibshirani R, Aas T, Geisler S, et al. Gene expression patterns of breast carcinomas distinguish tumor subclasses with clinical implications. Proc Natl Acad Sci U S A. 2001;98:10869–10874. - PMC - PubMed
    1. Hess KR, Anderson K, Symmans WF, Valero V, Ibrahim N, et al. Pharmacogenomic predictor of sensitivity to preoperative chemotherapy with paclitaxel and fluorouracil, doxorubicin, and cyclophosphamide in breast cancer. J Clin Oncol. 2006;24:4236–4244. - PubMed
    1. Farmer P, Bonnefoi H, Anderle P, Cameron D, Wirapati P, et al. A stroma-related gene signature predicts resistance to neoadjuvant chemotherapy in breast cancer. Nat Med. 2009;15:68–74. - PubMed
    1. Saal LH, Johansson P, Holm K, Gruvberger-Saal SK, She QB, et al. Poor prognosis in carcinoma is associated with a gene expression signature of aberrant PTEN tumor suppressor pathway activity. Proc Natl Acad Sci U S A. 2007;104:7564–7569. - PMC - PubMed

Publication types