. 2011 Mar;9(3):e1001032.
doi: 10.1371/journal.pbio.1001032. Epub 2011 Mar 22.

Membrane potential-dependent modulation of recurrent inhibition in rat neocortex

Affiliations

Membrane potential-dependent modulation of recurrent inhibition in rat neocortex

Jie Zhu et al. PLoS Biol. 2011 Mar.

Abstract

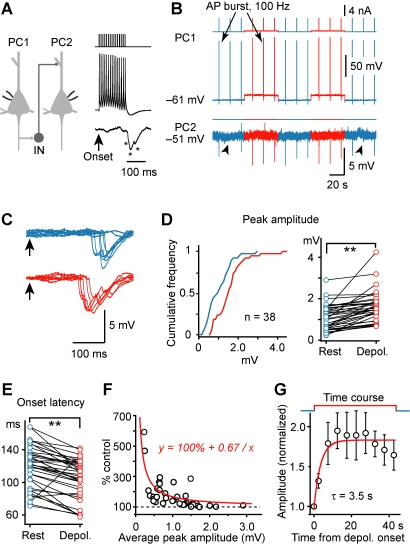
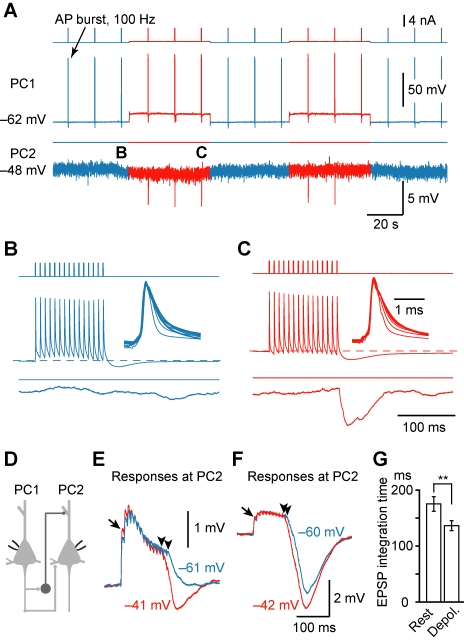
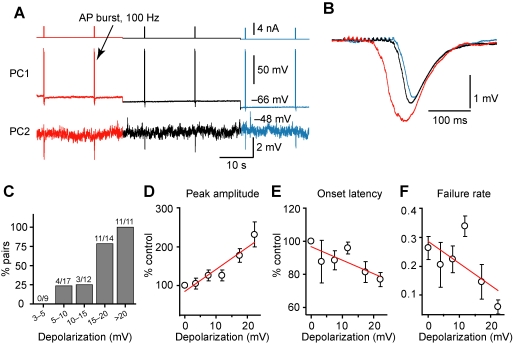
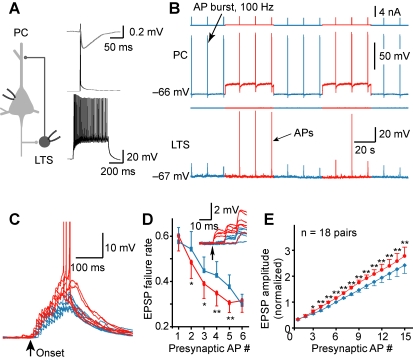
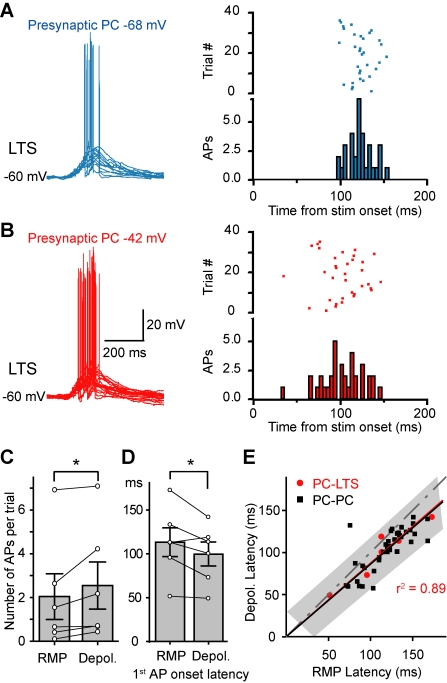
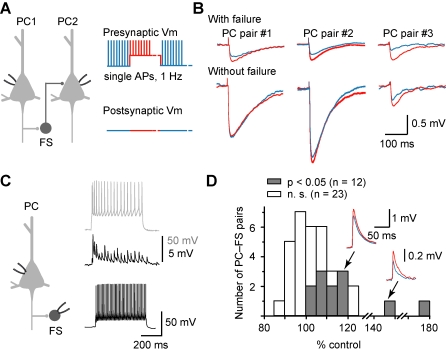
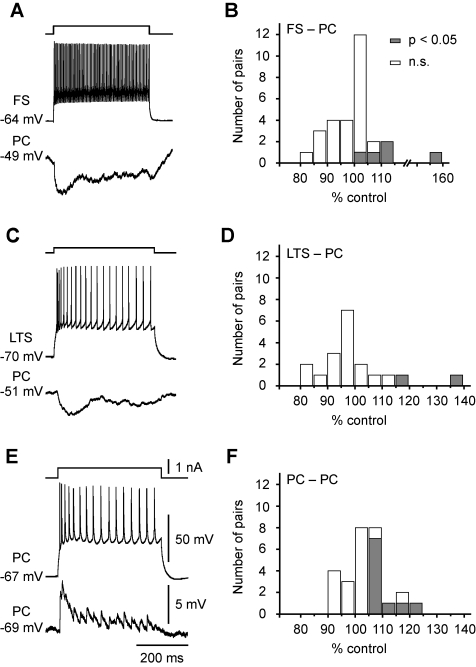
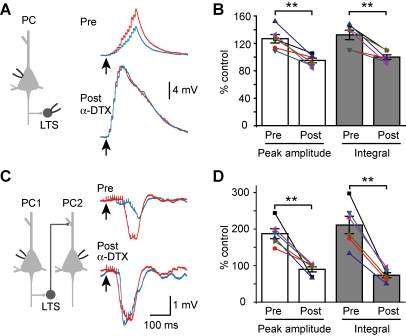
Dynamic balance of excitation and inhibition is crucial for network stability and cortical processing, but it is unclear how this balance is achieved at different membrane potentials (V(m)) of cortical neurons, as found during persistent activity or slow V(m) oscillation. Here we report that a V(m)-dependent modulation of recurrent inhibition between pyramidal cells (PCs) contributes to the excitation-inhibition balance. Whole-cell recording from paired layer-5 PCs in rat somatosensory cortical slices revealed that both the slow and the fast disynaptic IPSPs, presumably mediated by low-threshold spiking and fast spiking interneurons, respectively, were modulated by changes in presynaptic V(m). Somatic depolarization (>5 mV) of the presynaptic PC substantially increased the amplitude and shortened the onset latency of the slow disynaptic IPSPs in neighboring PCs, leading to a narrowed time window for EPSP integration. A similar increase in the amplitude of the fast disynaptic IPSPs in response to presynaptic depolarization was also observed. Further paired recording from PCs and interneurons revealed that PC depolarization increases EPSP amplitude and thus elevates interneuronal firing and inhibition of neighboring PCs, a reflection of the analog mode of excitatory synaptic transmission between PCs and interneurons. Together, these results revealed an immediate V(m)-dependent modulation of cortical inhibition, a key strategy through which the cortex dynamically maintains the balance of excitation and inhibition at different states of cortical activity.


Conflict of interest statement

The authors have declared that no competing interests exist.

Figures

Figure 1
Figure 1. Modulation of slow (late-onset) disynaptic IPSP by presynaptic somatic V m.
(A) Left, schematic diagram of the PC-PC paired recording (IN indicates those unidentified inhibitory interneurons that mediate the disynaptic IPSPs). Right, an AP burst (15 APs at 100 Hz) evoked by a train of current injection in PC1 induced a disynaptic response in PC2 with a long latency from the onset of the AP burst. * indicates individual IPSPs. (B) Example recording showing that presynaptic depolarization increased the amplitude of AP burst-induced disynaptic IPSPs. (C) Overlay of the IPSPs evoked at resting (blue) and depolarized (red) V m in the presynaptic PC. Arrows indicate the onset of the AP train. Notice that presynaptic depolarization caused a reduction in failure, increased the amplitude, and shortened the latency of the disynaptic IPSPs. (D) Left, cumulative frequency distribution of the tested connections (n = 38 PC-PC pairs) by the average amplitude of disynaptic IPSP at resting (blue) and depolarized V m (red); right, pooled results showing changes of the average amplitude at the two V m levels in individual PC-PC pairs. (E) Pooled results (n = 38 pairs) showing that the onset latency of IPSPs was shortened by presynaptic depolarization. (F) The percentage increase was dependent on the average amplitude of disynaptic IPSPs (n = 38 pairs). Red line, hyperbolic fit. (G) Average time course of the facilitation in PC-PC pairs that showed significant increase in IPSP amplitude (n = 12 pairs tested). Error bars represent s.e.m. ** p<0.01.
Figure 2
Figure 2. Presynaptic depolarization turns on recurrent inhibition and shortens the integration time of EPSPs.
(A) Example PC-PC paired recording showing that the disynaptic IPSP only occurred at a depolarized V m. (B and C) Parts in (A) were expanded for clarity. Insets, overlay of the somatic APs during the train indicating that no AP failure occurred. (D) Schematic drawing of the recordings (for E–G) from PC-PC pair that had both the monosynaptic excitatory connections and the disynaptic inhibitory connections. (E) An example showing that disynaptic IPSP (average of 33 trials), which occurred only when the presynaptic V m was depolarized, shortened the EPSP summation time (arrowheads). The arrow indicates a facilitated EPSP. (F) Similar example (average of 15 trials) as shown in (E) except that disynaptic IPSP occurred at both depolarized and resting presynaptic V m. Note the difference in the time window of EPSP summation (arrowheads). (G) Group data (n = 9 PC-PC pairs) indicated that presynaptic depolarization shortened the time window for EPSP integration. ** p<0.01.
Figure 3
Figure 3. V m-dependence of disynaptic IPSP facilitation.
(A) Example PC-PC paired recording showing that the amplitude of disynaptic IPSP was closely associated with presynaptic V m levels. (B) Overlay of the averaged IPSPs at different presynaptic V m levels. Notice the changes of the IPSP amplitude and onset latency. Same PC-PC pair as in (A). (C) Bar plot of percentage of pairs that showed facilitation of disynaptic IPSPs at different levels of presynaptic depolarization. Notice that depolarization progressively increased the percentage of pairs that exhibited facilitation. (D) Group data showing that the IPSP amplitude correlated closely with the level of depolarization. (E) Onset latency shortened with depolarizing V m. (F) Failure rate of the disynaptic IPSPs decreased with depolarizing V m. Red lines indicate linear fits of the data. Data were shown as mean ± s.e.m.
Figure 4
Figure 4. V m-dependent modulation of the slow recurrent inhibition is mediated by LTS interneurons.
(A) Left, schematic diagram of the PC-LTS paired recording. Right, the characteristic firing pattern of the LTS was shown at the bottom (in response to a square pulse of 0.2 nA); single AP (middle) in the LTS could evoke an IPSP (top) in the PC. (B) Example recording from the PC-LTS pair shown in (A). Presynaptic depolarization (∼20 mV) increased the peak amplitude of the summated EPSPs (evoked by a burst of 15 APs at 100 Hz in the PC) and occasionally caused AP firing in the LTS. (C) Overlay of the summated EPSPs recorded at the LTS. Note the facilitated EPSPs. (D) The failure rate of the 2nd to 5th EPSPs decreased after presynaptic depolarization. Inset, example traces showing EPSP failures occurred at resting (blue) and depolarized V m (red); arrow indicates the onset of the presynaptic AP train. (E) Group data (mean ± s.e.m., including EPSP failures) indicating the facilitation of individual EPSPs after presynaptic depolarization. Peak amplitudes of individual EPSPs were normalized to the 6th EPSP at resting presynaptic V m. See also Figure S3.
Figure 5
Figure 5. PC depolarization increases the number and reduces the onset latency of LTS APs.
(A) Left, overlay of example postsynaptic responses of LTS to a train of presynaptic APs at resting presynaptic V m. Right, rasters and peristimulus histogram showing the number and timing of APs in LTS across trials. (B) Same cell as in (A). Presynaptic V m was depolarized to −42 mV. Notice the increase in number of APs and the decrease in AP onset latency. (C) Presynaptic depolarization significantly increased the number of APs per trial in LTS cells. (D) Comparison of the 1st AP onset latency at resting versus depolarizing V m. mean ± s.e.m. * p<0.05. See also Figure S4. (E) Plot of the onset latency of disynaptic IPSPs in PC-PC pairs (black symbols; data from Figure 1) and LTS spiking in PC-LTS pairs (red symbols; data from panel D) at depolarized V m as a function of those at resting V m. Note that the majority of the points lie below the dotted line (slope = 1), indicating the latencies at depolarized V m were shorter than those at resting V m. Gray area indicates the 95% prediction bounds for IPSP latencies. Note that the points for LTS spiking latencies fall in this prediction bounds. The black and red lines are the linear regression fits for the IPSP and LTS spiking latencies, respectively.
Figure 6
Figure 6. V m-dependent modulation of fast (early-onset) disynaptic IPSP.
(A) Schematic diagram showing the PC-PC paired recording and the protocol of stimulation. Brief injection (1 ms) of depolarizing current pulses to the presynaptic PC evoked single APs at a rate of 1 Hz, while periodic constant current injection caused ∼20 mV depolarization from the resting V m. The resting and depolarized periods were ∼15 s each. The dotted lines indicate a break in the time axis. (B) PC-PC paired recordings tested with the protocol shown in (A). Traces (average of at least 300 trials) from three pairs showing that the average disynaptic IPSP at depolarized V m (red) were larger than that at resting V m (blue) when IPSP failures were included. (C) PC-FS paired recording. Left: recording configuration. Right: bottom trace showing the non-adapting fast-spiking pattern of the recorded FS neuron in response to a current pulse (0.4 nA); the middle trace indicates the depressing EPSPs in FS neuron in response to a train of APs in the PC (0.3 nA, top trace). (D) Group data from PC-FS pairs using similar protocol as in (A). Significant EPSP facilitation was observed in 12 out of 35 pairs. Inset: example traces (average of at least 300 trials) from two PC-FS pairs.
Figure 7
Figure 7. V m-dependent modulation of monosynaptic IPSPs and PC-PC EPSPs.
(A) Example recording showing inhibitory connection in a FS-PC pair. (B) Group data from FS-PC pairs. Filled boxes, pairs that showed significant increase in the average peak amplitude of IPSPs evoked by single APs (1 Hz, similar protocol as in Figure 6A) after presynaptic depolarization (∼20 mV). Open boxes, pairs without significant facilitation. (C) Example recording showing inhibitory connection in a LTS-PC pair. (D) Group data for LTS-PC pairs. (E) Example recording showing excitatory connection in a PC-PC pair. (F) Group data for PC-PC pairs.
Figure 8
Figure 8. Role of Kv1 channels in the V m-dependent modulation of disynaptic IPSPs.
(A) Left, schematic diagram of the PC-LTS pair recording. Right, an example recording showing that bath application of α-DTX (100 nM) increased the size of disynaptic IPSPs and occluded the facilitation induced by PC depolarization. Blue and red traces are the averaged EPSPs evoked by trains of APs (same protocol as in Figure 4) at resting and depolarized V m, respectively. Note the depolarization-induced facilitation of the summated EPSPs before α-DTX application. (B) Group data (n = 6) showing that α-DTX diminished the depolarization-induced increases in the peak amplitude and the integral of the summated EPSPs. (C) Similar recording as shown in Figure 1. Note that α-DTX not only mimicked the depolarization-induced facilitation but also occluded the effect of V m changes. (D) Group data (n = 6) showing that α-DTX blocked the V m shift-induced changes in the peak amplitude and the integral of disynaptic IPSPs. ** p<0.01. See also Figure S5.

Comment in

  • Finding balance in cortical networks.
    Meadows R. Meadows R. PLoS Biol. 2011 Mar;9(3):e1001035. doi: 10.1371/journal.pbio.1001035. Epub 2011 Mar 22. PLoS Biol. 2011. PMID: 21445331 Free PMC article. No abstract available.

Similar articles

Cited by

References

    1. Haider B, Duque A, Hasenstaub A. R, McCormick D. A. Neocortical network activity in vivo is generated through a dynamic balance of excitation and inhibition. J Neurosci. 2006;26:4535–4545. - PMC - PubMed
    1. Okun M, Lampl I. Instantaneous correlation of excitation and inhibition during ongoing and sensory-evoked activities. Nat Neurosci. 2008;11:535–537. - PubMed
    1. Shu Y, Hasenstaub A, McCormick D. A. Turning on and off recurrent balanced cortical activity. Nature. 2003;423:288–293. - PubMed
    1. Monier C, Chavane F, Baudot P, Graham L. J, Fregnac Y. Orientation and direction selectivity of synaptic inputs in visual cortical neurons: a diversity of combinations produces spike tuning. Neuron. 2003;37:663–680. - PubMed
    1. Wehr M, Zador A. M. Synaptic mechanisms of forward suppression in rat auditory cortex. Neuron. 2005;47:437–445. - PubMed

Publication types

Substances