. 2011 Mar 22;6(3):e14777.
doi: 10.1371/journal.pone.0014777.

Investigation of parameters that affect the success rate of microarray-based allele-specific hybridization assays

Affiliations

Investigation of parameters that affect the success rate of microarray-based allele-specific hybridization assays

Lena Poulsen et al. PLoS One. .

Abstract

Background: The development of microarray-based genetic tests for diseases that are caused by known mutations is becoming increasingly important. The key obstacle to developing functional genotyping assays is that such mutations need to be genotyped regardless of their location in genomic regions. These regions include large variations in G+C content, and structural features like hairpins.

Methods/findings: We describe a rational, stable method for screening and combining assay conditions for the genetic analysis of 42 Phenylketonuria-associated mutations in the phenylalanine hydroxylase gene. The mutations are located in regions with large variations in G+C content (20-75%). Custom-made microarrays with different lengths of complementary probe sequences and spacers were hybridized with pooled PCR products of 12 exons from each of 38 individual patient DNA samples. The arrays were washed with eight buffers with different stringencies in a custom-made microfluidic system. The data were used to assess which parameters play significant roles in assay development.

Conclusions: Several assay development methods found suitable probes and assay conditions for a functional test for all investigated mutation sites. Probe length, probe spacer length, and assay stringency sufficed as variable parameters in the search for a functional multiplex assay. We discuss the optimal assay development methods for several different scenarios.


Conflict of interest statement

Competing Interests: The authors have declared that no competing interests exist.

Figures

Figure 1
Figure 1. Experimental design.
For each PAH mutation that was genotyped, 14 different probes were designed comprising 7 lengths (13 to 25-mer) wildtype (Wt) probe and corresponding Tm-matched mutant (Mt) probe. For simplicity, Mt probes are denoted with the same number as corresponding Wt probe. In reality Mt probes could differ one or two bases in length in order to obtain similar calculated Tm as the corresponding mutant probe. The probes (PAH capture-sequence) were placed in three different positions: the proximal, central or distal part of the 60-mer oligonucleotide (Materials and Methods). With these triplicates of each probe there were a total of 42 spots/probes per PAH mutation. These 42 spots per SNP per probe position were repeated trice per subarray. The array was replicated in 8 identical sub-arrays on the custom-made Agilent slide. For mutations near a common SNP, additional probes were designed (see Materials and Methods). The microarray slide (all 8 sub-arrays) was hybridized with amplified patient material. The slide was then washed in a multi-stringency array washer. Each sub-array was washed at 37°C with different stringency wash buffers all containing 0.1% SDS and varying SSC (as indicated). Furthermore, the wash buffer for two sub-arrays contained the denaturant urea. After quantification (Materials and Methods) normalized ratios were calculated for each probe-pair. Alternative ratios (R+2nt and R−2nt) (Supplementary Figure S1) were calculated as indicated. For R+2nt a Wt probe (for example 15-mer) was combined with the Mt probe that was designed to Tm-match the Wt probe that was 2 nucleotides longer (here, 17-mer Wt probe). The reverse was the case for the R−2nt. The probe-pair (length, position and ratio calculation) and stringency that resulted in the best classification genotypes near ideal values: wild-types 1, heterozygotes 0.5 and mutants 0 (Figure 3 and Table 1) are highlighted for three mutations (c.117C>G, c.143T>C and c.688G>A).
Figure 2
Figure 2. Methods A–D for calling genotypes.
Graphical illustration of allowed ratio values for each method for calling genotypes. Method A requires that the difference (d) between the minimum Wt/Wt (wild-type) ratio and maximum Wt/Mt (heterozygote) ratio, as well as difference (d) between the minimum Wt/Mt (heterozygote) ratio and maximum Mt/Mt (mutant) ratio is >0.05. Method B requires that the difference (d) between the minimum Wt/Wt ratio and maximum Wt/Mt ratio, as well as the difference (d) between the minimum Wt/Mt ratio and maximum Mt/Mt ratio is >0.1. Method C requires that the minimum Wt/Wt ratio is >0.7, the maximum Wt/Mt ratio is <0.65, the minimum Wt/Mt ratio is >0.35 and the maximum Mt/Mt ratio is <0.3. Method D requires that the minimum Wt/Wt ratio is >0.7, the maximum Wt/Mt ratio is <0.6, the minimum Wt/Mt ratio is >0.4 and the maximum Mt/Mt ratio is <0.3. For methods A and B, three examples (Ex1–Ex3) of acceptable ratio values are shown. As the examples illustrate, the criteria for methods A and B for calling genotypes are fulfilled if the difference (d) between the different genotypes (wild-type, heterozygote and mutant) is greater than 0.05 or 0.1, respectively, regardless of whether the ratio values generally are high, intermediate or low.
Figure 3
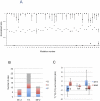
Figure 3. Genotyping the 44 different mutated PAH alleles*.
A) For each mutation, the probe-pair (probe length, position from surface and Wt and Mt probe combination) and assay condition (stringency) for the best separation of genotypes is shown. Details about PAH mutations, probe-pairs and assay conditions are found in Table 1. Best separation was defined as wild-type (Wt/Wt) normalized ratios (see Materials and Methods section) clustering around 1, heterozygotes (Wt/Mt) around 0.5 and mutants (Mt/Mt) around 0. For each mutation, the average ratio of all samples carrying the wild-type DNA sequence on both alleles is represented by a diamond, the average normalized ratios for heterozygous samples is represented by a dash, and the average normalized ratio for homozygous mutated is represented by a triangle. Error bars show the observed minimum and maximum ratios. *42 unique PAH mutations and 44 different mutant PAH alleles were investigated (see Materials and Methods). B) Number of sites that were genotyped with Tm-matched probe-pairs or alternative probe-pairs The data was obtained by analysing Table 1. C) ΔTm (difference in Tm between wild type and mutant probe) and ΔΔG (difference between ΔG of wild type probe and mutant probe) of probe-pair function in the shown genotyped PAH mutations (A).
Figure 4
Figure 4. Percentage of successfully genotyped mutations for each assay strategy employed.
Each column is the average percentage of successfully genotyped mutations obtained by using probes in the proximal, central and distal position (except for strategy 1 and 3 where all positions were varied). Error bars are maximum and minimum percentage of successfully genotyped mutations in one of the three positions (proximal, central or distal). A total of nine assay strategies (strategy 1–9) were investigated by varying (open square) or fixing (closed square) the following assay parameters: melting temperature Tm, probe length, position, stringency and probe-pair combination. The performance of each assay strategy was found as the percentage of successfully genotyped mutations using A) Method A for calling genotypes, B) Method B for calling genotypes, C) Method C for calling genotypes and D) Method D for calling genotypes.
Figure 5
Figure 5. Overview over different assay development strategies.
A) After choosing the method for calling genotypes (Figure 2) or for genotyping loci, placed in genomic regions with wide to narrow ranges in G+C content, the choice to run the assay at a single or at many assay stringencies is made. Based on the above selections “Input criteria” the parameters (Opt. Param.) that need to be optimized/flexible are shown below with the achieved success rate (SR) (percentage of mutations successfully genotyped). The parameters that must be optimized are probe length/Tm, spacer length (position of probe relative to array surface) and alternative combinations of wildtype and mutant probe in probe-pairs (Alt probes). The success rate obtained in this study (genotyping of PAH mutations) is valid for the wide range in G+C content. The results from a narrow range in G+C content are from genotyping mutations in the HBB gene (reference). B) The steps in bottom-up (left) and top-down (right) assay strategies are listed. The bottom-up approach is an iterative process with many rounds of probe design, testing and the redesigning of probes. In contrast the top-down approach only utilizes one optimization experiment including all parameters needed for a functional assay.

References

    1. Zhang L, Miles MF, Aldape KD. A model of molecular interactions on short oligonucleotide microarrays. Nature Biotechnology. 2003;21:818–821. - PubMed
    1. Wick LM, Rouillard JM, Whittam TS, Gulari E, Tiedje JM, et al. On-chip non-equilibrium dissociation curves and dissociation rate constants as methods to assess specificity of oligonucleotide probes. Nucleic Acids Res. 2006;34:e26. - PMC - PubMed
    1. Suzuki S, Ono N, Furusawa C, Kashiwagi A, Yomo T. Experimental optimization of probe length to increase the sequence specificity of high-density oligonucleotide microarrays. Bmc Genomics. 2007;16(8):373. - PMC - PubMed
    1. Pozhitkov A, Noble PA, Domazet-Loso T, Nolte AW, Sonnenberg R, et al. Tests of rRNA hybridization to microarrays suggest that hybridization characteristics of oligonucleotide probes for species discrimination cannot be predicted. Nucleic Acids Res. 2006;34:e66. - PMC - PubMed
    1. Mei R, Hubbell E, Bekiranov S, Mittmann M, Christians FC, Shen MM, et al. Probe selection for high-density oligonucleotide arrays. Proc Natl Acad Sci U S A. 2003;100:11237–11242. - PMC - PubMed

Publication types