. 2011 Mar 22;6(3):e17625.
doi: 10.1371/journal.pone.0017625.

Global array-based transcriptomics from minimal input RNA utilising an optimal RNA isolation process combined with SPIA cDNA probes

Affiliations

Global array-based transcriptomics from minimal input RNA utilising an optimal RNA isolation process combined with SPIA cDNA probes

Laura Kennedy et al. PLoS One. .

Abstract

Technical advances in the collection of clinical material, such as laser capture microdissection and cell sorting, provide the advantage of yielding more refined and homogenous populations of cells. However, these attractive advantages are counter balanced by the significant difficulty in obtaining adequate nucleic acid yields to allow transcriptomic analyses. Established technologies are available to carry out global transcriptomics using nanograms of input RNA, however, many clinical samples of low cell content would be expected to yield RNA within the picogram range. To fully exploit these clinical samples the challenge of isolating adequate RNA yield directly and generating sufficient microarray probes for global transcriptional profiling from this low level RNA input has been addressed in the current report. We have established an optimised RNA isolation workflow specifically designed to yield maximal RNA from minimal cell numbers. This procedure obtained RNA yield sufficient for carrying out global transcriptional profiling from vascular endothelial cell biopsies, clinical material not previously amenable to global transcriptomic approaches. In addition, by assessing the performance of two linear isothermal probe generation methods at decreasing input levels of good quality RNA we demonstrated robust detection of a class of low abundance transcripts (GPCRs) at input levels within the picogram range, a lower level of RNA input (50 pg) than previously reported for global transcriptional profiling and report the ability to interrogate the transcriptome from only 10 pg of input RNA. By exploiting an optimal RNA isolation workflow specifically for samples of low cell content, and linear isothermal RNA amplification methods for low level RNA input we were able to perform global transcriptomics on valuable and potentially informative clinically derived vascular endothelial biopsies here for the first time. These workflows provide the ability to robustly exploit ever more common clinical samples yielding extremely low cell numbers and RNA yields for global transcriptomics.


Conflict of interest statement

Competing Interests: GM, CG, GF & DC are employees of legacy Wyeth Research and latterly Pfizer Global Research & Development (PGRD). Wyeth Research provided funding to the Translational Medicine Research Collaboration (TMRC) of which this study is part. This does not alter the authors' adherence to all the PLoS ONE policies on sharing data and materials, as detailed online in the guide for authors.

Figures

Figure 1
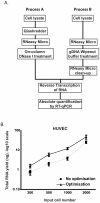
Figure 1. Comparison of experimental workflows for optimised total RNA isolation from minimal cell numbers.
(A) Titrated HUVEC samples were processed for RNA isolation through Process A or B to establish the optimal workflow for RNA yield from minimal cell numbers. (B) HUVECs were titrated over a range of 3000 - 200 cells per tube and split in to 6 aliquots for cell lysis and RNA isolation. Triplicate samples were processed using either process A or B. All samples were then quantified by reverse transcription of the entire yielded RNA and real-time quantitative PCR using SybrGreen probe and β-actin primers against a standard curve of known HUVEC RNA input. Error bars  =  standard deviation.
Figure 2
Figure 2. Experimental workflow to assess efficiency of NuGen probe generation technologies using low amounts of input RNA.
HUVEC total RNA was titrated to cover a range of input RNA from 50 ng–10 pg. 50 ng (n = 1), 500 pg (n = 2) and 250 pg (n = 2) of total RNA was used as input for the WT-Ovation FFPE system V2 while 500 pg (n = 2), 250 pg (n = 2), 100 pg (n = 2), 50 pg (n = 2) and 10 pg (n = 2) were used as input for the WT-Ovation One-Direct system (NuGen Technologies, Inc). All cDNA reactions were purified via Zymo Research Clean and Concentrator™-25 or Qiagen RNeasy MinElute Cleanup kits (WT-Ovation FFPE V2 and WT-Ovation One-Direct systems respectively) as recommended. All purified cDNA probes were assessed for quantity and quality using the Agilent 2100 Bioanalyzer and the Nanodrop-8000 RNA Nano chips. FL-Ovation™ cDNA Biotin Module V2 (NuGEN) was used for fragmentation and biotin labelling of 5 µg of cDNA and used for subsequent hybridisation to Affymetrix HGU133 Plus 2.0 microarrays.
Figure 3
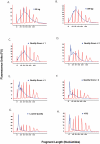
Figure 3. Bioanalyser electropherograms of cDNA probes generated using the WT-Ovation FFPE RNA amplification system V2 and the WT-Ovation One-Direct RNA amplification system.
cDNA quality assessed by distribution of size with the x-axis representing polynucleotide length and the y-axis representing arbitrary signal intensity fluorescence units. Electropherograms of representative cDNA from each WT-Ovation system are shown. (A) WT-Ovation FFPE system sscDNA synthesised from 50 ng of RNA is distributed 500–1000 nucleotides. The sscDNA synthesised from 500 pg and 250 pg of RNA input in the WT-Ovation FFPE system show a similar distribution to the sscDNA synthesised from 50 ng of RNA. (B) The majority of dscDNA fragments synthesised in the WT-Ovation One-Direct system average in length at approximately 100–150 nucleotides. RNA input level does not influence polynucleotide length (500 and 250 pg input shown). A significant difference in polynucleotide distribution is observed in 500 pg and 250 pg input RNA reactions depending on which WT-Ovation system used for probe synthesis. (C) In the WT-Ovation One-Direct system, the dscDNA probes generated from a reaction containing RNA template is distinct from that generated in a parallel no template control.
Figure 4
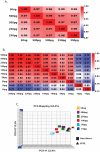
Figure 4. Pearson's Correlation of the signal (MAS5.0) obtained from Affymetrix GeneChips hybridised with cDNA probes synthesised using the NuGen WT-Ovation RNA amplification systems and the effect of reducing RNA input on the resultant Affymetrix GeneChips.
(A) R2 values generated when comparing one GeneChip from 50 ng of input HUVEC RNA and duplicate GeneChips from 500 pg and 250 pg of input HUVEC RNA using MAS5.0 analysed data by Pearson's correlation of signal. (B) Duplicate GeneChips from 500 pg, 250 pg, 100 pg, 50 pg and 10 pg RNA input compared using MAS5.0 analysed data by Pearson's correlation of signal. C. Principal Component Analysis of all probe sets from GeneChips hybridised with cDNA probes from either WT-Ovation FFPE or WT-Ovation One-Direct RNA amplification systems.
Figure 5
Figure 5. Low abundant probeset retention with decreasing RNA input levels.
Data from the microarrays generated according to the workflow set out in Figure 2 was filtered for those probe sets representing a family of proteins, G protein-coupled receptors (GPCR), known to be of low abundance and difficult to detect using microarrays. The signal intensity was set at a threshold of Log2≥6 or Log2≥7 to ensure analysis of probe sets demonstrating strong hybridisation and robust signal. Data plotted is the number of GPCR probe sets present with differing RNA input levels and the number of genes that are represented in parenthesis below the data point. When duplicate GeneChips were available only the probe sets passing threshold in both duplicates were included. Venn diagrams illustrate the overlap of common genes between GeneChips from titrated RNA input levels for either WT-Ovation FFPE or WT-One-Direct RNA amplification systems.
Figure 6
Figure 6. Bioanalyser electropherograms of cDNA probes synthesised by the WT-Ovation FFPE RNA amplification system V2 and the WT-Ovation One-Direct RNA amplification system using a vascular endothelial cell biopsy sample.
cDNA quality assessed by distribution of size with the x-axis representing polynucleotide length and y-axis representing arbitrary signal intensity fluorescence units. Using a vascular endothelial cell biopsy sample a shift to shorter cDNA lengths is apparent compared to 500 pg total HUVEC RNA input in both the (A) WT-Ovation FFPE RNA amplification system V2 and the (B) WT-Ovation One-Direct RNA amplification system. NTC  =  no template control.
Figure 7
Figure 7. Assignment of “quality score” to sscDNA probes.
Quality scores of 1–4 for sscDNA were assigned following visual assessment of distribution of polynucleotide size, with representative electropherograms shown here. (A) sscDNA synthesised from 50 ng total HUVEC RNA represents an amplification positive control of highest quality achievable. (B) sscDNA synthesised from 300 pg total HUVEC RNA amplification positive control of highest quality that could be expected from 300 pg of input RNA. (C–G) sscDNA synthesised from 300 pg of total RNA from a vascular endothelial biopsy sample. sscDNA has a electropherogram similar to that seen in the positive controls, peaking at over 500 nts and so was attributed a cDNA quality of 1 (C). sscDNAs progressively shorter in size distribution were designated quality scores of 2, 3 or 4 (D–G). sscDNAs designated lowest quality and therefore not hybridised to GeneChips (C) were of predominantly <200 nts in length. (H) No template control (NTC).
Figure 8
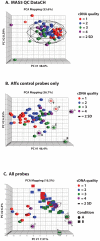
Figure 8. Assessing GeneChip quality control metrics and the effects of cDNA probe quality using Principle Components Analysis.
(A) MAS5.0 QC data generated in Expression Console (Affymetrix) displayed using PCA illustrates the majority of GeneChips (n = 64) clustering together within 2 standard deviations of the group mean. The PCA is coloured according to the sscDNA quality score designated to each sample. Of the small number of samples lying out with the 2 SD boundary, sscDNA quality does not appear to be responsible for the variation shown, with this being contributed by other experimental factors. (B) PCA visualisation of Affx control probes only, coloured by sscDNA quality score shows that a significant proportion of the variation is driven by quality of the sscDNA probes. (C) PCA visualisation including all probes reveals the distinct sub-groups of the cohort according to expressed transcriptome patterns, regardless of cDNA quality.

Similar articles

Cited by

References

    1. Bos PD, Zhang XH, Nadal C, Shu W, Gomis RR, et al. Genes that mediate breast cancer metastasis to the brain. Nature. 2009;459:1005–1009. - PMC - PubMed
    1. Chee M, Yang R, Hubbell E, Berno A, Huang XC, et al. Accessing genetic information with high-density DNA arrays. Science. 1996;274:610–614. - PubMed
    1. Pomeroy SL, Tamayo P, Gaasenbeek M, Sturla LM, Angelo M, et al. Prediction of central nervous system embryonal tumour outcome based on gene expression. Nature. 2002;415:436–442. - PubMed
    1. Cobleigh MA, Tabesh B, Bitterman P, Baker J, Cronin M, et al. Tumor gene expression and prognosis in breast cancer patients with 10 or more positive lymph nodes. Clin Cancer Res. 2005;11:8623–8631. - PubMed
    1. Glas AM, Floore A, Delahaye LJ, Witteveen AT, Pover RC, et al. Converting a breast cancer microarray signature into a high-throughput diagnostic test. BMC Genomics. 2006;7:278. - PMC - PubMed

Publication types