

Hop tests correlate with IKDC and KOOS at minimum of 2 years after primary ACL reconstruction
- PMID: 21445595
- PMCID: PMC3417814
- DOI: 10.1007/s00167-011-1473-5
Hop tests correlate with IKDC and KOOS at minimum of 2 years after primary ACL reconstruction
Abstract
Purpose: The hypothesis of this study was that single-legged horizontal hop test ratios would correlate with IKDC, KOOS, and Marx activity level scores in patients 2 years after primary ACL reconstruction.
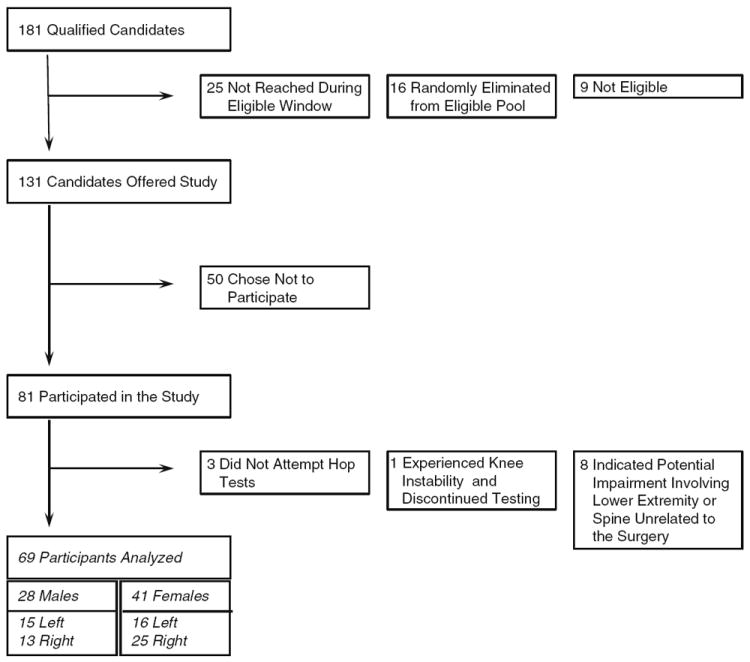
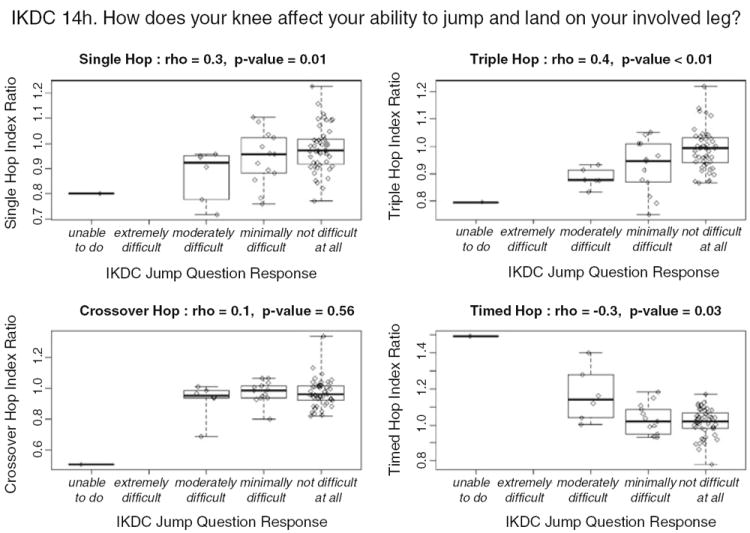
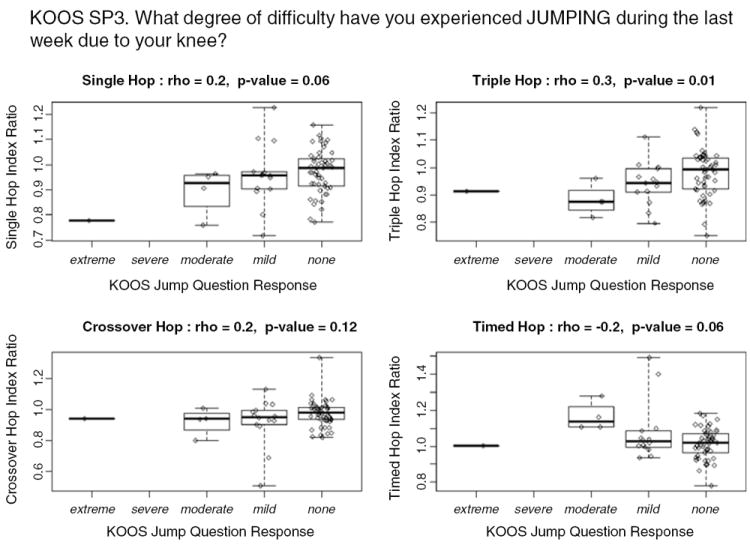
Methods: Individual patient-reported outcome tools and hop test ratios on 69 ACL reconstructed patients were compared using correlations and multivariable modeling. Correlations between specific questions on the IKDC and KOOS concerning the ability to jump and hop ratios were also performed.
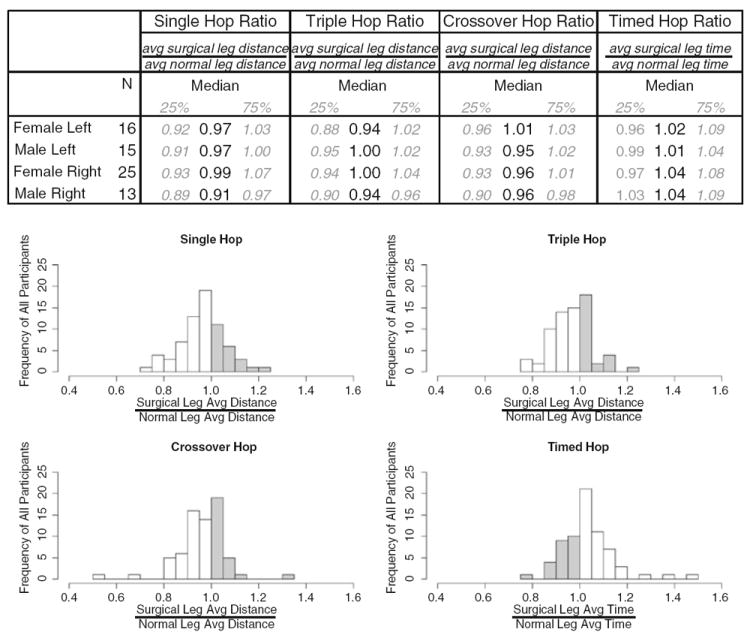
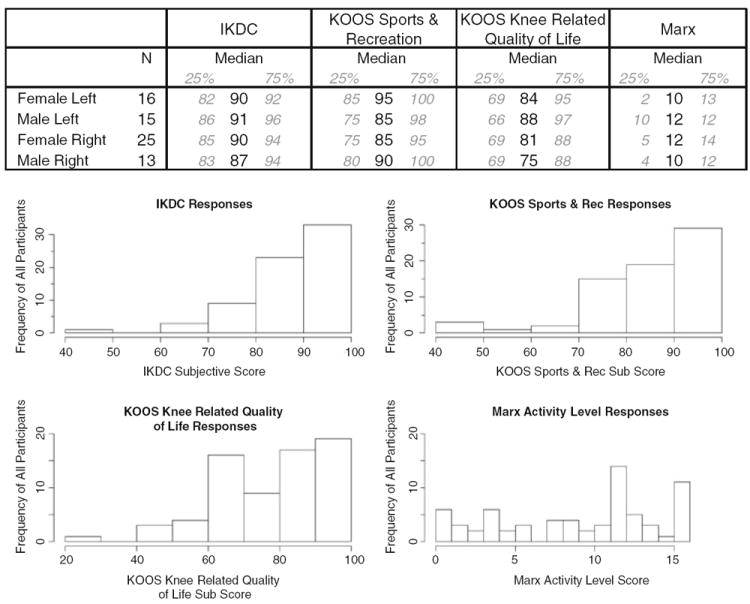
Results: The triple-hop ratio was moderately but significantly correlated with the IKDC, KOOS Sports and Recreation subscale, and the KOOS Knee Related Quality of Life subscale, as well as with the specific questions related to jumping. Similar but weaker relationship patterns were found for the single-hop ratio and timed hop. No significant correlations were found for the Marx activity level or crossover-hop ratio. Multivariable modeling showed almost no significant additional contribution to predictability of the IKDC or KOOS subscores by gender, BMI, or the number of faults on either leg.
Conclusions: The triple-hop test is most significantly correlated with patient-reported outcome scores. Multivariable modeling indicates that less than a quarter of the variability in outcome scores can be explained by hop test results. This indicates that neither test can serve as a direct proxy for the other; however, assessment of patient physical function by either direct report using validated outcome tools or by the hop test will provide relatively comparable data.
Figures
Similar articles
-
Report of the Clinical and Functional Primary Outcomes in Men of the ACL-SPORTS Trial: Similar Outcomes in Men Receiving Secondary Prevention With and Without Perturbation Training 1 and 2 Years After ACL Reconstruction.Clin Orthop Relat Res. 2017 Oct;475(10):2523-2534. doi: 10.1007/s11999-017-5280-2. Clin Orthop Relat Res. 2017. PMID: 28224443 Free PMC article. Clinical Trial.
-
Muscle strength and hop performance criteria prior to return to sports after ACL reconstruction.Knee Surg Sports Traumatol Arthrosc. 2011 Nov;19(11):1798-805. doi: 10.1007/s00167-011-1669-8. Epub 2011 Sep 20. Knee Surg Sports Traumatol Arthrosc. 2011. PMID: 21932078 Review.
-
Effect of graft choice on the outcome of revision anterior cruciate ligament reconstruction in the Multicenter ACL Revision Study (MARS) Cohort.Am J Sports Med. 2014 Oct;42(10):2301-10. doi: 10.1177/0363546514549005. Am J Sports Med. 2014. PMID: 25274353 Free PMC article.
-
IKDC or KOOS: which one captures symptoms and disabilities most important to patients who have undergone initial anterior cruciate ligament reconstruction?Am J Sports Med. 2010 Jul;38(7):1395-404. doi: 10.1177/0363546509359678. Epub 2010 Mar 29. Am J Sports Med. 2010. PMID: 20351201
-
Single-legged hop tests as predictors of self-reported knee function after anterior cruciate ligament reconstruction: the Delaware-Oslo ACL cohort study.Am J Sports Med. 2012 Oct;40(10):2348-56. doi: 10.1177/0363546512457551. Epub 2012 Aug 27. Am J Sports Med. 2012. PMID: 22926749 Free PMC article.
Cited by
-
Long-term outcomes of anterior cruciate ligament reconstruction surgery: 2020 OREF clinical research award paper.J Orthop Res. 2021 May;39(5):1041-1051. doi: 10.1002/jor.24794. Epub 2020 Jul 17. J Orthop Res. 2021. PMID: 32639610 Free PMC article. Clinical Trial.
-
Isolated lateral extra-articular tenodesis in ACL-deficient knees: in vivo knee kinematics and clinical outcomes.Knee Surg Sports Traumatol Arthrosc. 2023 Aug;31(8):3212-3220. doi: 10.1007/s00167-023-07344-9. Epub 2023 Feb 22. Knee Surg Sports Traumatol Arthrosc. 2023. PMID: 36810948
-
Single-Leg Hop Test Performance and Isokinetic Knee Strength After Anterior Cruciate Ligament Reconstruction in Athletes.Orthop J Sports Med. 2017 Nov 14;5(11):2325967117739811. doi: 10.1177/2325967117739811. eCollection 2017 Nov. Orthop J Sports Med. 2017. PMID: 29164167 Free PMC article.
-
Individual hop analysis and reactive strength ratios provide better discrimination of ACL reconstructed limb deficits than triple hop for distance scores in athletes returning to sport.Knee. 2020 Oct;27(5):1357-1364. doi: 10.1016/j.knee.2020.07.003. Epub 2020 Jul 28. Knee. 2020. PMID: 33010748 Free PMC article.
-
Quantitative MRI Biomarkers to Predict Risk of Reinjury Within 2 Years After Bridge-Enhanced ACL Restoration.Am J Sports Med. 2023 Feb;51(2):413-421. doi: 10.1177/03635465221142323. Epub 2023 Jan 16. Am J Sports Med. 2023. PMID: 36645042 Free PMC article.
References
-
- Ageberg E, Thomee R, Neeter C, et al. Muscle strength and functional performance in patients with anterior cruciate ligament injury treated with training and surgical reconstruction or training only: a two to five-year followup. Arthritis Rheum. 2008;59:1773–1779. - PubMed
-
- Anderson AF, Irrgang JJ, Kocher MS, et al. The International Knee Documentation Committee subjective knee evaluation form: normative data. Am J Sports Med. 2006;34:128–135. - PubMed
-
- Bach BR, Jr, Tradonsky S, Bojchuk J, et al. Arthroscopically assisted anterior cruciate ligament reconstruction using patellar tendon autograft. Five- to nine-year follow-up evaluation. Am J Sports Med. 1998;26:20–29. - PubMed
-
- Bent NP, Wright CC, Rushton AB, et al. Selecting outcome measures in sports medicine: a guide for practitioners using the example of anterior cruciate ligament rehabilitation. Br J Sports Med. 2009;43:1006–1012. - PubMed
-
- Cohen J. Statistical power analysis for the behavioral sciences. 2. Erlbaum Associates, Inc.; Hillsdale: 1988.
Publication types
MeSH terms
Grants and funding
LinkOut - more resources
Full Text Sources
Medical
