Comparative Study
. 2012 Jan;18(1):11-26.
doi: 10.1007/s00894-011-1021-8. Epub 2011 Mar 29.

A comparative study of the hydrogen-bonding patterns and prototropism in solid 2-thiocytosine (potential antileukemic agent) and cytosine, as studied by 1H-14N NQDR and QTAIM/ DFT

Affiliations
Comparative Study

A comparative study of the hydrogen-bonding patterns and prototropism in solid 2-thiocytosine (potential antileukemic agent) and cytosine, as studied by 1H-14N NQDR and QTAIM/ DFT

Jolanta N Latosińska et al. J Mol Model. 2012 Jan.

Abstract

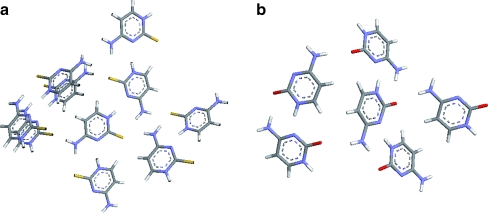
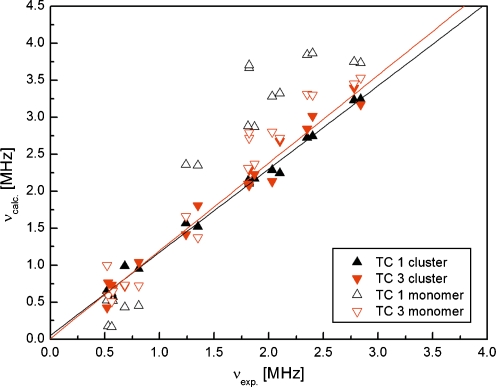
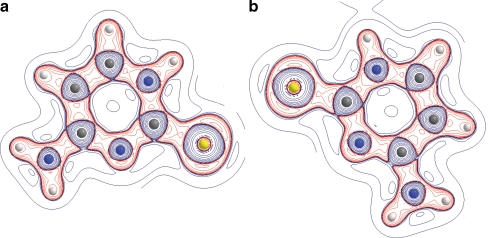
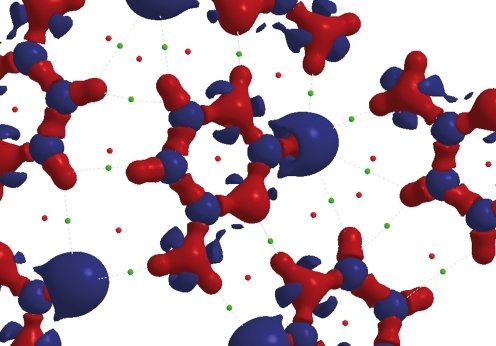
A potential antileukemic and anticancer agent, 2-thiocytosine (2-TC), has been studied experimentally in the solid state by (1)H-(14)N NMR-NQR double resonance (NQDR) and theoretically by the quantum theory of atoms in molecules (QTAIM)/density functional theory (DFT). Eighteen resonance frequencies on (14)N were detected at 180 K and assigned to particular nitrogen sites (-NH(2), -N=, and -NH-) in 2-thiocytosine. Factors such as the nonequivalence of molecules (connected to the duplication of sites) and possible prototropic tautomerism (capable of modifying the type of site due to proton transfer) were taken into account during frequency assignment. The result of replacing oxygen with sulfur, which leads to changes in the intermolecular interaction pattern and molecular aggregation, is discussed. This study demonstrates the advantages of combining NQDR and DFT to extract detailed information on the H-bonding properties of crystals with complex H-bonding networks. Solid-state properties were found to have a profound impact on the stabilities and reactivities of both compounds.


Figures

Figure
Figure
The experimental 1H-14N NQDR spectrum of 2-thiocytosine obtained at T = 180 K by the solid effect technique (left) and 3d distribution of the electron density Laplacian calculated by DFT (right)
Fig. 1
Fig. 1
Tautomeric structures of 2-thiocytosine
Fig. 2
Fig. 2
The experimental 1H-14N NQDR spectrum of 2-thiocytosine obtained at T = 180 K by the solid effect technique at the proton Larmor frequency ν L = 100 kHz. Using this technique, three dips are generally observed around the NQR frequency ν Q at the frequencies ν Q and ν Q ± ν L. The dip at the frequency ν Q + ν L is usually the most pronounced. The 14N NQR frequencies, as confirmed by the two-frequency irradiation techniques and assigned to various nitrogen positions in the molecule on the basis of DFT calculations, are shown on the frequency scale
Fig. 3
Fig. 3
Molecular aggregations formed by the intermolecular bonds (1D layer): a 2-thiocytosine (12 molecules) and b cytosine (six molecules)
Fig. 4
Fig. 4
The correlation between the experimental and calculated NQR frequencies (monomers and clusters of TC1 and TC3; solid line linear fit for cluster)
Fig. 5
Fig. 5
The 3d distribution of the electron density Laplacian calculated by DFT for 2-thiocytosine (isocontour ±0.35 a.u.); the regions of negative Laplacian are shown in red, the regions of positive Laplacian in blue, small circles correspond to critical points (red RCP, green BCP)
Fig. 6
Fig. 6
Laplacian contours in 2-thiocytosine. Left: molecule A; right: molecule B (negative regions in red, positive regions in blue)
Fig. 7
Fig. 7
3d distribution of the electron density Laplacian calculated by DFT for cytosine (isocontour ±0.35 a.u.); the regions of negative Laplacian are shown in red and the regions of positive Laplacian in blue; small circles correspond to critical points (red RCP, green BCP)
Fig. 8
Fig. 8
Laplacian contours in cytosine (negative regions in red, positive regions in blue)
Fig. 9
Fig. 9
The correlation between the experimental and calculated NQR frequencies for cytosine and 2-thiocytosine, showing the influence of π–π stacking

References

    1. Carbon J, David H, Studier MH (1968) Science 161:1146–1147 - PubMed
    1. Roosaf RA, DeLamater ED. Cancer Res. 1960;20:1543–1554. - PubMed
    1. Timson J, Price DJ (1972) In: Darlington CD, Lewis KR, Hafner PF (eds) Chromosomes today, vol 3. Wiley, New York, p 118
    1. Timson J, Price DJ, Walker JS. Cytobios. 1972;5:97–100.
    1. Lozzio CB, Wigler PW. J Cell Physiol. 1971;78:25–31. doi: 10.1002/jcp.1040780105. - DOI - PubMed

Publication types

LinkOut - more resources