. 2011 Apr;17(4):409-17.
doi: 10.1002/lt.22246.

Laboratory test results after living liver donation in the adult-to-adult living donor liver transplantation cohort study

Collaborators, Affiliations

Laboratory test results after living liver donation in the adult-to-adult living donor liver transplantation cohort study

James F Trotter et al. Liver Transpl. 2011 Apr.

Abstract

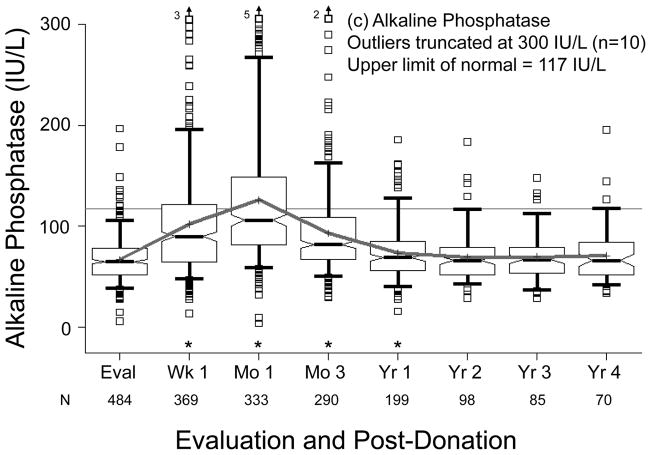
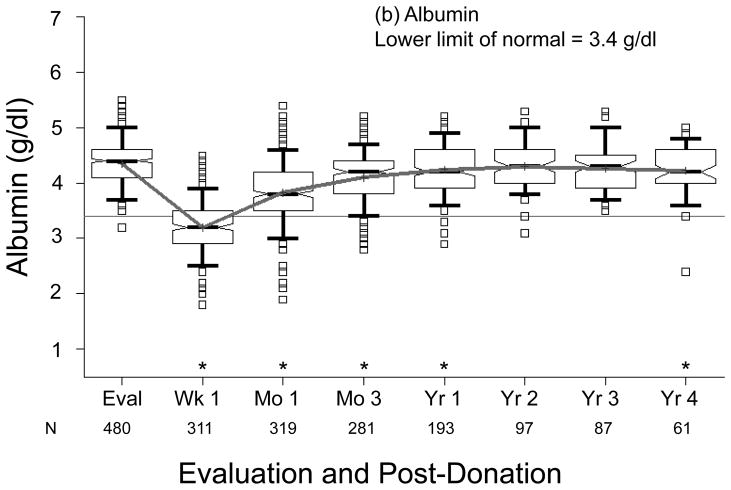
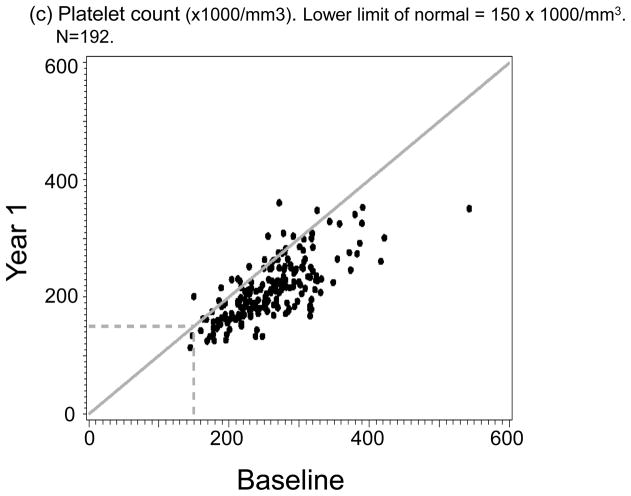
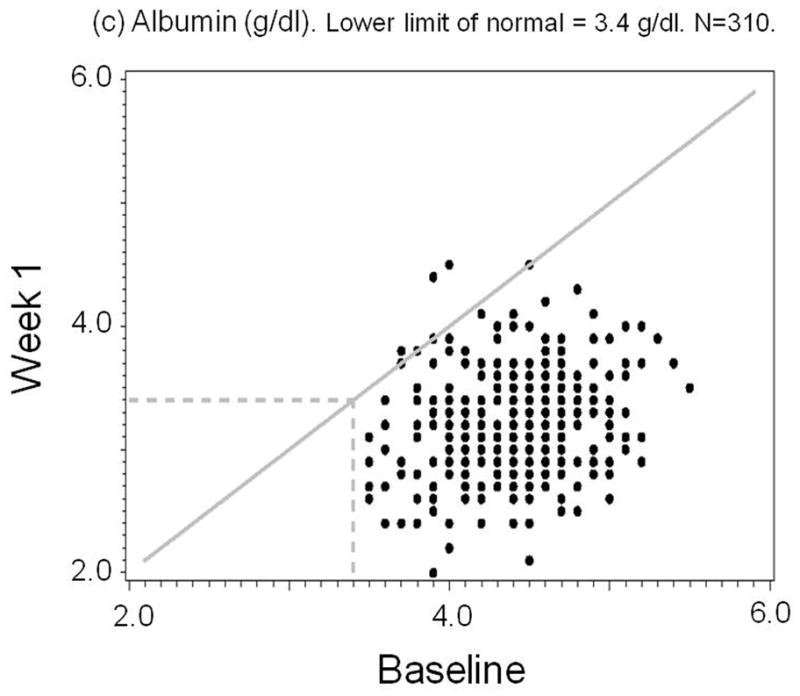
Information on the long-term health of living liver donors is incomplete. Because changes in standard laboratory tests may reflect the underlying health of donors, results before and after donation were examined in the Adult-to-Adult Living Donor Liver Transplantation Cohort Study (A2ALL). A2ALL followed 487 living liver donors who donated at 9 US transplant centers between 1998 and 2009. The aminotransferase [aspartate aminotransferase (AST) and alanine aminotransferase (ALT)] and alkaline phosphatase (AP) activities, bilirubin, international normalized ratio (INR), albumin, white blood cell count (WBC), hemoglobin (HGB), platelet count, ferritin, serum creatinine (SCR), and blood urea nitrogen (BUN) were measured at the evaluation and after donation (1 week, 1 month, 3 months, 1 year, and yearly thereafter). Repeated measures models were used to estimate median laboratory values at each time point and to test for differences between values at the evaluation (baseline) and postdonation time points. Platelet counts were significantly decreased at every time point in comparison with the baseline, and at 3 years, they were 19% lower. Approximately 10% of donors had a platelet count < 150 × 1000/mm(3) 2 to 3 years post-donation. Donors with a platelet count ≤ 150 × 1000/mm(3) at 1 year had significantly lower mean platelet counts (189 ± 32 × 1000/mm(3) ) versus the remainder of the cohort (267 ± 56 × 1000/mm(3) , P < 0.0001) at the evaluation. Statistically significant differences compared to the evaluation values were noted for AST, AP, INR, and albumin through the first year, although most measurements were in the normal range. The median values for WBC, HGB, ferritin, albumin, SCR, BUN, and INR were not substantially outside the normal range at any time point. In conclusion, after 3 months, most laboratory values return to normal among right hepatic lobe liver donors, with a slower return to baseline levels for AST, AP, INR, and albumin. Persistently decreased platelet counts warrant further investigation.


Figures

Figure 1
Figure 1
a-d. Laboratory tests at evaluation (Eval) and 7 time points post-donation. Asterisks just above x-axis indicate time points where the median is significantly different from Eval (p<0.05). Boxes include the 25th to 75th percentiles, with indentation indicating median and “+” indicating mean values (connected by grey line). Whiskers extend to the 5th and 95th percentiles.
Figure 1
Figure 1
a-d. Laboratory tests at evaluation (Eval) and 7 time points post-donation. Asterisks just above x-axis indicate time points where the median is significantly different from Eval (p<0.05). Boxes include the 25th to 75th percentiles, with indentation indicating median and “+” indicating mean values (connected by grey line). Whiskers extend to the 5th and 95th percentiles.
Figure 2
Figure 2
a-c. Laboratory tests at evaluation (Eval) and 7 time points post-donation. Asterisks just above x-axis indicate time points where the median is significantly different from Eval (p<0.05). Boxes include the 25th to 75th percentiles, with indentation indicating median and “+” indicating mean values (connected by grey line). Whiskers extend to the 5th and 95th percentiles.
Figure 2
Figure 2
a-c. Laboratory tests at evaluation (Eval) and 7 time points post-donation. Asterisks just above x-axis indicate time points where the median is significantly different from Eval (p<0.05). Boxes include the 25th to 75th percentiles, with indentation indicating median and “+” indicating mean values (connected by grey line). Whiskers extend to the 5th and 95th percentiles.
Figure 3
Figure 3
a-d. Laboratory values at year 1 versus baseline. Diagonal line indicates the line of equality; points below the diagonal indicate larger values at baseline; points above the diagonal indicate larger values at year 1.
Figure 3
Figure 3
a-d. Laboratory values at year 1 versus baseline. Diagonal line indicates the line of equality; points below the diagonal indicate larger values at baseline; points above the diagonal indicate larger values at year 1.
Figure 3
Figure 3
a-d. Laboratory values at year 1 versus baseline. Diagonal line indicates the line of equality; points below the diagonal indicate larger values at baseline; points above the diagonal indicate larger values at year 1.
Figure 3
Figure 3
a-d. Laboratory values at year 1 versus baseline. Diagonal line indicates the line of equality; points below the diagonal indicate larger values at baseline; points above the diagonal indicate larger values at year 1.
Figure 4
Figure 4
a-c. Laboratory values at year 1 versus baseline. Diagonal line indicates the line of equality; points below the diagonal indicate larger values at baseline; points above the diagonal indicate larger values at year 1.
Figure 4
Figure 4
a-c. Laboratory values at year 1 versus baseline. Diagonal line indicates the line of equality; points below the diagonal indicate larger values at baseline; points above the diagonal indicate larger values at year 1.
Figure 4
Figure 4
a-c. Laboratory values at year 1 versus baseline. Diagonal line indicates the line of equality; points below the diagonal indicate larger values at baseline; points above the diagonal indicate larger values at year 1.
Figure 5
Figure 5
a-d. Laboratory values at week 1 (a and c) or month 1 (b and d) versus baseline. Diagonal line indicates the line of equality; points below the diagonal indicate larger values at baseline; points above the diagonal indicate larger values at year 1.
Figure 5
Figure 5
a-d. Laboratory values at week 1 (a and c) or month 1 (b and d) versus baseline. Diagonal line indicates the line of equality; points below the diagonal indicate larger values at baseline; points above the diagonal indicate larger values at year 1.
Figure 5
Figure 5
a-d. Laboratory values at week 1 (a and c) or month 1 (b and d) versus baseline. Diagonal line indicates the line of equality; points below the diagonal indicate larger values at baseline; points above the diagonal indicate larger values at year 1.
Figure 5
Figure 5
a-d. Laboratory values at week 1 (a and c) or month 1 (b and d) versus baseline. Diagonal line indicates the line of equality; points below the diagonal indicate larger values at baseline; points above the diagonal indicate larger values at year 1.

Comment in

  • Small-for-size donor syndrome?
    Millis JM. Millis JM. Liver Transpl. 2011 Apr;17(4):355-6. doi: 10.1002/lt.22277. Liver Transpl. 2011. PMID: 21445917 No abstract available.

References

    1. Brown RS, Jr, Russo MW, Lai M, Shiffman ML, Richardson MC, Everhart JE, Hoofnagle JH. A survey of liver transplantation from living adult donors in the United States. N Engl J Med. 2003;348:818–25. - PubMed
    1. Lo CM. Complications and long-term outcome of living liver donors: a survey of 1,508 cases in five Asian centers. Transplantation. 2003;75:S12–5. - PubMed
    1. Ghobrial RM, Freise CE, Trotter JF, Tong L, Ojo A, Fair JH, Fisher RA, Emond JC, Koffron AJ, Pruett TL, Olthoff KM the A2ALL Study Group. Donor morbidity after living donation for liver transplantation. Gastroenterology. 2008;136:468–76. - PMC - PubMed
    1. Rudow DL, Brown RS, Jr, Emond JC, Marratta D, Bellemare S, Kinkhabwala M. One-year morbidity after donor right hepatectomy. Liver Transpl. 2004;10:1428–31. - PubMed
    1. Nagasako Y, Jin MB, Miyazaki H, Nakayama M, Shimamura T, Furukawa H, Matushita M, Todo S. Thrombopoietin in postoperative thrombocytopenia following living donor hepatectomy. Liver Transpl. 2006;12:435–9. - PubMed

Publication types

Substances