. 2011 Oct;66(4):1089-99.
doi: 10.1002/mrm.22908. Epub 2011 Mar 28.

Clinically constrained optimization of flexTPI acquisition parameters for the tissue sodium concentration bioscale

Affiliations

Clinically constrained optimization of flexTPI acquisition parameters for the tissue sodium concentration bioscale

Ian C Atkinson et al. Magn Reson Med. 2011 Oct.

Abstract

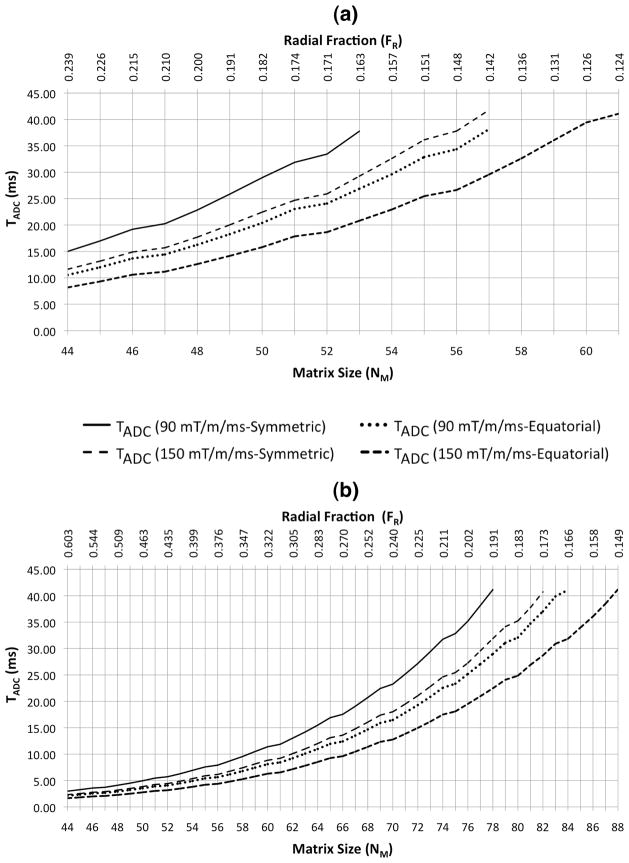
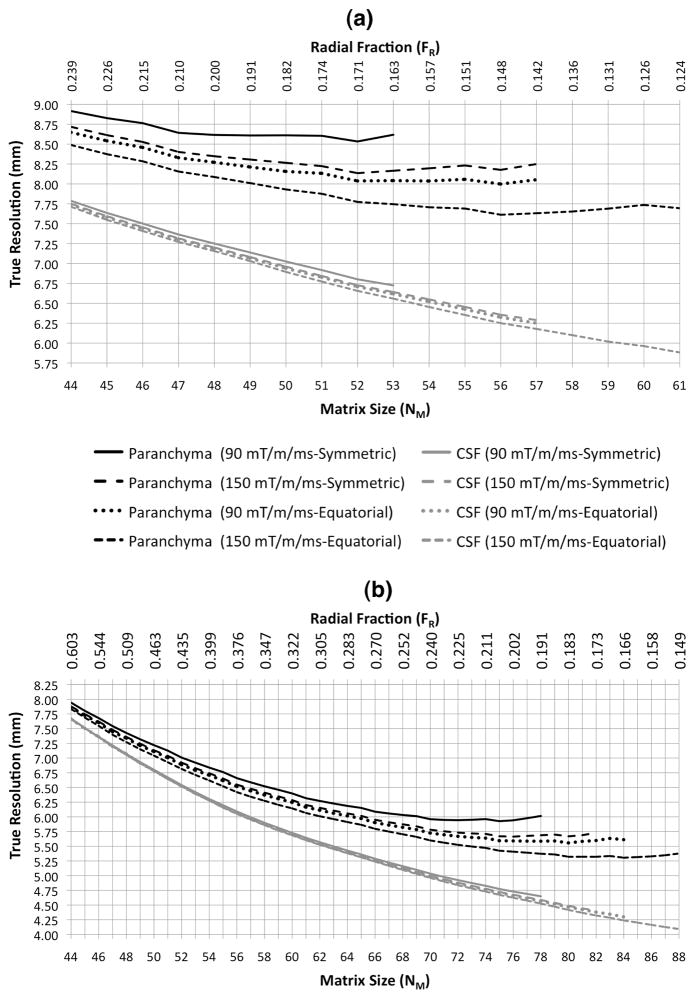
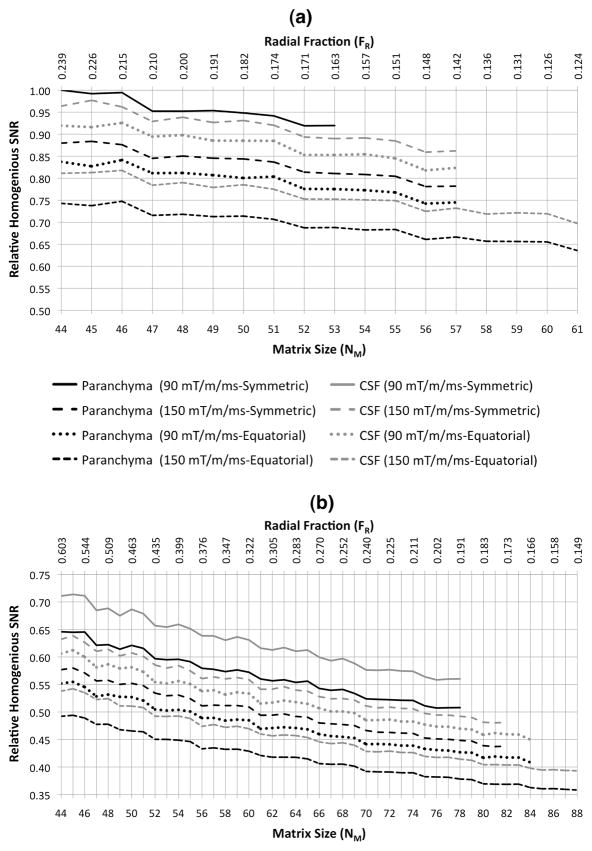
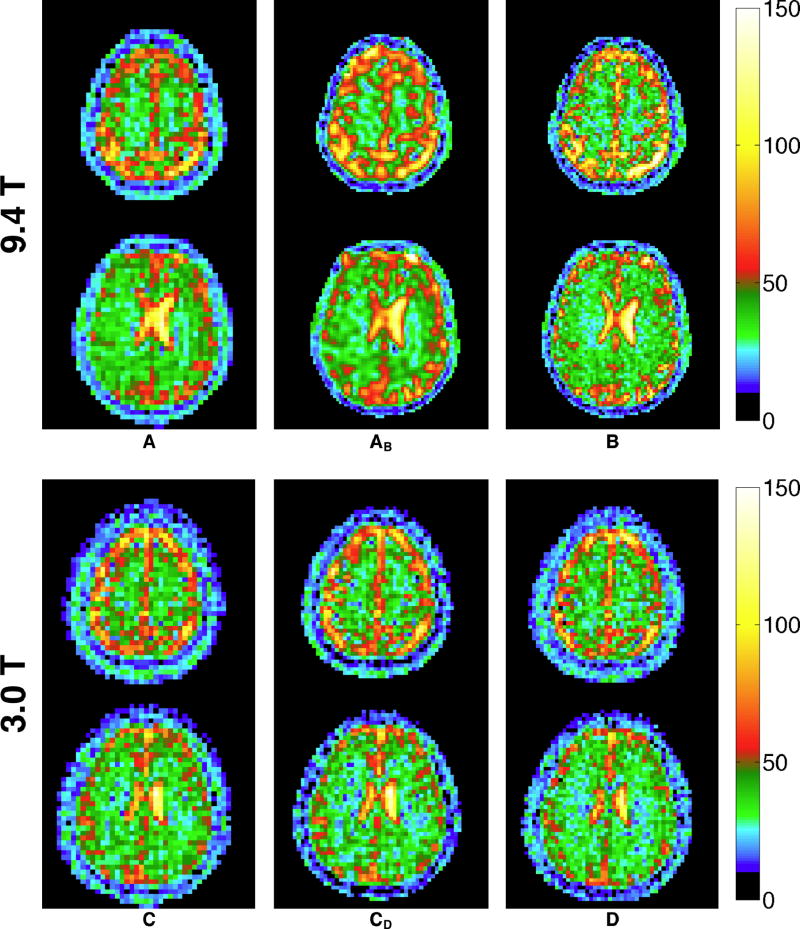
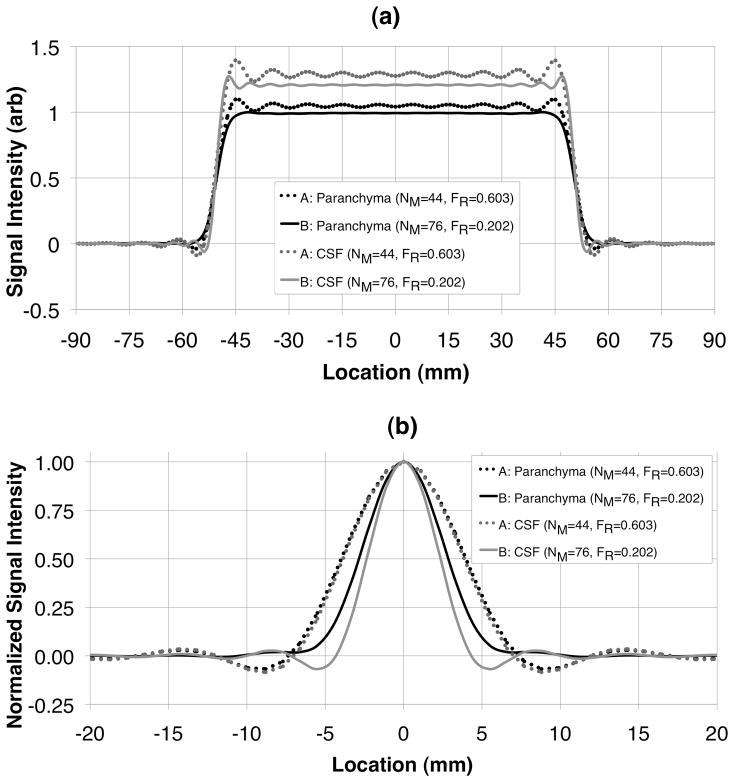
The rapid transverse relaxation of the sodium magnetic resonance signal during spatial encoding causes a loss of image resolution, an effect known as T(2)-blurring. Conventional wisdom suggests that spatial resolution is maximized by keeping the readout duration as short as possible to minimize T(2)-blurring. Flexible twisted projection imaging performed with an ultrashort echo time, relative to T(2), and a long repetition time, relative to T(1), has been shown to be effective for quantitative sodium magnetic resonance imaging. A minimized readout duration requires a very large number of projections and, consequentially, results in an impractically long total acquisition time to meet these conditions. When the total acquisition time is limited to a clinically practical duration (e.g., 10 min), the optimal parameters for maximal spatial resolution of a flexible twisted projection imaging acquisition do not correspond to the shortest possible readout. Simulation and experimental results for resolution optimized acquisition parameters of quantitative sodium flexible twisted projection imaging of parenchyma and cerebrospinal fluid are presented for the human brain at 9.4 and 3.0T. The effect of signal loss during data collection on sodium quantification bias and image signal-to-noise ratio are discussed.


Figures

Figure 1
Figure 1
Two schemes (Symmetric, Equatorial) for separating the k-space sphere into nested cones are possible for flexTPI. The nested cones can be symmetrically placed about the KX-KY plane (left, symmetric layout) such that there are no cones of radius KMAX (“equator” cone in KX-KY plane) or zero (“polar” cones lying along z-axis). Alternatively, the cones can be designed with equatorial and polar cones (right, equatorial layout). The two designs impose slightly different slew rate constraints. KMAX, the number of cones, and total number of projections depend on the acquisition FOV and matrix size.
Figure 2
Figure 2
Simulated signal intensity from a unit amplitude point source with a bi-exponential decay (60% T2=2.5 ms, 40% T2=14 ms) for a flexTPI acquisition (GMAX=5 mT/m, SMAX=200 mT/m/ms, FR=0.15, FOV=20 cm, NM=60). The thick line is the signal intensity as a function of k-space radius, which has a non-exponential form (relative to k-space radius). The thin line is the signal intensity as a function of time with the conventional exponential form and corresponds to the signal for a comparable radial acquisition. The vertical dashed line indicates the point at which flexTPI trajectories transition from radial to twisting.
Figure 3
Figure 3
Pairs of (FR, NM) satisfying four values of TTOTAL constraint (6, 8, 10, 12 minutes) for a TR=160 ms and symmetric k-space cones. For any specified total acquisition time, there is a collection of (FR, NM) pairs that must be evaluated for resolution performance.
Figure 4
Figure 4
Readout duration for various values of FR for symmetric and equatorial cone nesting for flexTPI (FOV= 22 cm, NM=44, SMAX=150 mT/m/ms. In both cases, GMAXSlew (gray vertical line) achieves nearly the shortest TADC among all gradient amplitudes. The difference in minimum TADC that can be achieved for the two cone-nesting schemes shown in Figure 1 diminishes as FR increases.
Figure 5
Figure 5
Required readout time, TADC (ms), as a function of matrix size and radial fraction constrained to total acquisition times of TTOTAL = 4 (a) and 10 (b) minutes, respectively, for GMAX=GMAXSlew and both the symmetric and equatorial patterns of k-space trajectories at two different slew rates (90 mT/m/ms, 150 mT/m/ms).
Figure 6
Figure 6
True resolution (measured as FWHM of simulated PSF) as a function of matrix size as achieved in either brain parenchyma or CSF for a flexTPI acquisition constrained to TTOTAL = 4 (a) and 10 (b) minutes, respectively, for GMAX=GMAXSlew and both the symmetric and equatorial patterns of k-space trajectories at two different slew rates (90 mT/m/ms, 150 mT/m/ms).
Figure 7
Figure 7
Relative homogenous SNR as a function of matrix size for flexTPI acquisition with TTOTAL = 4 (a) and 10 (b) minutes, respectively. SNR values are relative to the homogenous SNR of tissue for TTOTAL=4 min, NM=44 and FR=0.603. Results for GMAX=GMAXSlew and both the symmetric and equatorial patterns of k-space trajectories at two different slew rates (90 mT/m/ms, 150 mT/m/ms) are shown.
Figure 8
Figure 8
Two representative slices from quantitative TSC maps in mM acquired at 9.4T (top) and 3T (bottom) on the same subject using the acquisition parameter sets shown in Tables 1 and 2, respectively. Acquisitions A (top, left column) and B (top, right column) were reconstructed at voxel sizes equal to their nominal resolutions of 5 mm and 2.89 mm, respectively. Column AB (top, center column) is the result of reconstructing acquisition A at the same voxel size as acquisition B. Both A and B have identical acquisition times of 10 minutes. Acquisition B has significantly improved resolution despite the longer readout duration (27.3 ms vs 2.3 ms). This matches the true resolution expected in CSF and brain parenchyma (see Table 1) determined from the PSF simulation. Acquisitions C (bottom, left column) and D (bottom, right column) were reconstructed at voxel sizes equal to their nominal resolutions of 5 mm and 3.92 mm, respectively. Column CD (bottom, center column) is the result of reconstructing acquisition C at the same voxel size as acquisition D. Both C and D have identical acquisition times of 8 minutes (two averages of a 4-minute acquisition. Acquisition C theoretically has slightly improved resolution in brain parenchyma (8.00 mm vs 8.65 mm), although the difference is difficult to appreciate visually.
Figure 9
Figure 9
Cross-sections of simulated 10 cm cube object (a) and point-spread functions normalized to unit amplitude (b) for brain parenchyma and CSF for acquisition parameter sets A and B shown in Table 1. The long readout of acquisition B results in a better FWHM resolution and significantly reduced Gibbs ringing more than the short readout of acquisition A.

References

    1. Thulborn KR, Gindin TS, Davis D, Erb P. Comprehensive MRI Protocol for Stroke Management: Tissue Sodium Concentration as a Measure of Tissue Viability in a Non-Human Primate Model and Clinical Studies. Radiology. 1999;139:26–34. - PubMed
    1. Lu A, Atkinson IC, Thulborn KR. Encyclopedia of Magnetic Resonance. Hoboken, NJ: John Wiley & Sons; 2010. Sodium magnetic resonance imaging and its bioscale of tissue sodium concentration. (in press)
    1. Thulborn KR, Lu A, Atkinson IC, Damen F, Villano JL. Quantitative sodium MR imaging and sodium bioscales for the management of brain tumors. Neuroimag Clin N Am. 2009;19:615–624. - PMC - PubMed
    1. Thulborn KR, Atkinson IC, Lu A. Metabolic Magnetic Resonance Imaging: A Case for Bioscales in Medicine. In: Faro Scott, Mohamed FB., editors. Functional Neuroradiology: Principles and Clinical Applications. Springer Science + Business Media, NY; NY: 2010. (in press)
    1. Hilal SK, Maudsley AA, Ra JB, Simon HE, Roschmann P, Wittekoek S, Cho ZH, Mun SK. In vivo NMR imaging of sodium-23 in the human head. J Comput Assist Tomogr. 1985;9(1):1–7. - PubMed

Publication types