

Changes in intracellular water diffusion and energetic metabolism in response to ischemia in perfused C6 rat glioma cells
- PMID: 21446036
- PMCID: PMC3621130
- DOI: 10.1002/mrm.22866
Changes in intracellular water diffusion and energetic metabolism in response to ischemia in perfused C6 rat glioma cells
Abstract
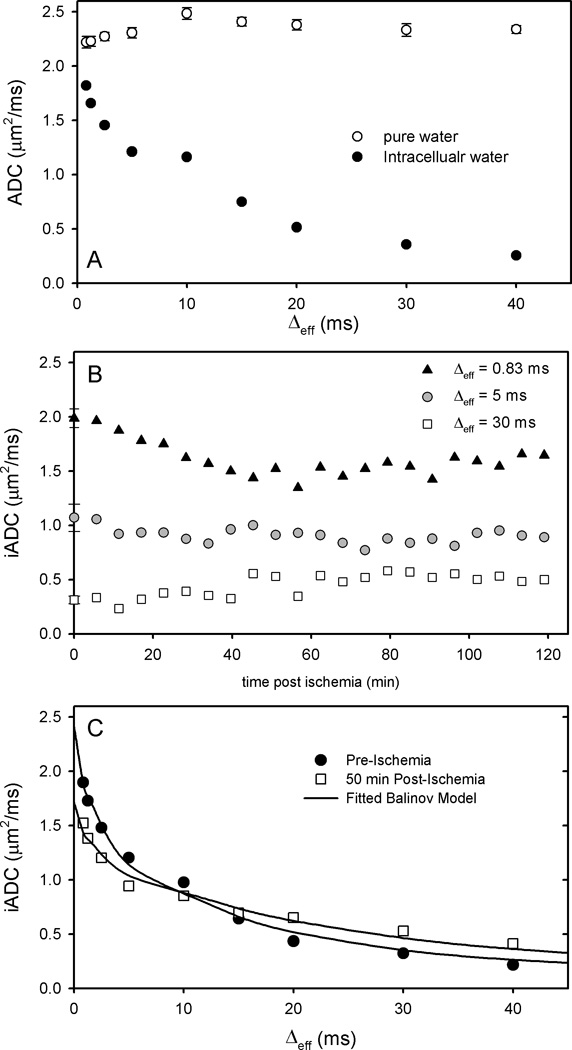
This work reports results of experiments in hollow-fiber bioreactor C6 glioma cell cultures where the apparent diffusion coefficient (ADC) of intracellular water (iADC) was measured at diffusion times between 0.83 and 40 ms. The experiments were carried out before and after the onset of permanent ischemia. The changes in iADC following ischemia were dependent on the diffusion time employed in the experiment. An ischemia-induced decrease in the iADC was measured at short diffusion times, while at long diffusion times the iADC increased. Decreases in the iADC measured at short diffusion times are interpreted to be a result of a decrease in the intrinsic diffusivity of intracellular water due to energy failure. Increases in iADC measured at long diffusion times, are interpreted to result from cell swelling.
Copyright © 2011 Wiley-Liss, Inc.
Figures


Similar articles
-
Ischemia-induced changes of intracellular water diffusion in rat glioma cell cultures.Magn Reson Med. 2008 Aug;60(2):258-64. doi: 10.1002/mrm.21616. Magn Reson Med. 2008. PMID: 18666112 Free PMC article.
-
Uncovering of intracellular water in cultured cells.Magn Reson Med. 2005 Jul;54(1):79-86. doi: 10.1002/mrm.20565. Magn Reson Med. 2005. PMID: 15968680 Free PMC article.
-
Water signal attenuation in diffusion-weighted 1H NMR experiments during cerebral ischemia: influence of intracellular restrictions, extracellular tortuosity, and exchange.Magn Reson Imaging. 1998 Nov;16(9):1023-32. doi: 10.1016/s0730-725x(98)00107-6. Magn Reson Imaging. 1998. PMID: 9839986
-
The role of diffusion tensor imaging in the evaluation of ischemic brain injury - a review.NMR Biomed. 2002 Nov-Dec;15(7-8):561-9. doi: 10.1002/nbm.786. NMR Biomed. 2002. PMID: 12489102 Review.
-
Imaging biomarkers guided anti-angiogenic therapy for malignant gliomas.Neuroimage Clin. 2018 Jul 5;20:51-60. doi: 10.1016/j.nicl.2018.07.001. eCollection 2018. Neuroimage Clin. 2018. PMID: 30069427 Free PMC article. Review.
Cited by
-
Magnetic Resonance Imaging for Drug Development.Adv Exp Med Biol. 2021;1310:187-209. doi: 10.1007/978-981-33-6064-8_9. Adv Exp Med Biol. 2021. PMID: 33834438
-
Translational MR Neuroimaging of Stroke and Recovery.Transl Stroke Res. 2017 Feb;8(1):22-32. doi: 10.1007/s12975-016-0497-z. Epub 2016 Aug 31. Transl Stroke Res. 2017. PMID: 27578048 Free PMC article. Review.
-
Bioreactor-Based Tumor Tissue Engineering.Acta Naturae. 2016 Jul-Sep;8(3):44-58. Acta Naturae. 2016. PMID: 27795843 Free PMC article.
-
Imaging of amide proton transfer and nuclear Overhauser enhancement in ischemic stroke with corrections for competing effects.NMR Biomed. 2015 Feb;28(2):200-9. doi: 10.1002/nbm.3243. Epub 2014 Dec 7. NMR Biomed. 2015. PMID: 25483870 Free PMC article.
-
Structural information revealed by the dispersion of ADC with frequency.Magn Reson Imaging. 2015 Nov;33(9):1083-1090. doi: 10.1016/j.mri.2015.06.009. Epub 2015 Jun 24. Magn Reson Imaging. 2015. PMID: 26117695 Free PMC article.
References
-
- Moseley ME, Cohen Y, Mintorovitch J, Chileuitt L, Shimizu H, Kucharczyk J, Wendland MF, Weinstein PR. Early detection of regional cerebral ischemia in cats: Comparison of diffusion- and T2-weighted MRI and spectroscopy. Magnetic Resonance in Medicine. 1990;14(2):330–346. - PubMed
-
- Warach S, Chien D, Li W, Ronthal M, Edelman RR. Fast magnetic resonance diffusion-weighted imaging of acute human stroke. Neurology. 1992;42(9):1717. - PubMed
-
- Syková E, Svoboda J, Polák J, Chvátal A. Extracellular volume fraction and diffusion characteristics during progressive ischemia and terminal anoxia in the spinal cord of the rat. J Cereb Blood Flow Metab. 1994 Mar;14(2):301–311. - PubMed
-
- Helpern JA, Ordidge RJ, Knight RA. The effect of cell membrane water permeability on the apparent diffusion coefficient of water. Berlin: 1992. p. 201.
Publication types
MeSH terms
Substances
Grants and funding
LinkOut - more resources
Full Text Sources
Other Literature Sources
Medical
