

Review
doi: 10.1021/ac1032325.
Epub 2011 Mar 29.
Second harmonic generation imaging microscopy: applications to diseases diagnostics
Affiliations
- PMID: 21446646
- PMCID: PMC3104727
- DOI: 10.1021/ac1032325
Item in Clipboard
Review
Second harmonic generation imaging microscopy: applications to diseases diagnostics
Anal Chem.
.
Abstract
Second Harmonic Generation microscopy has emerged as a powerful new optical imaging modality. This Feature describes its chemical and physical principles and highlights current applications in disease diagnostics.
Figures
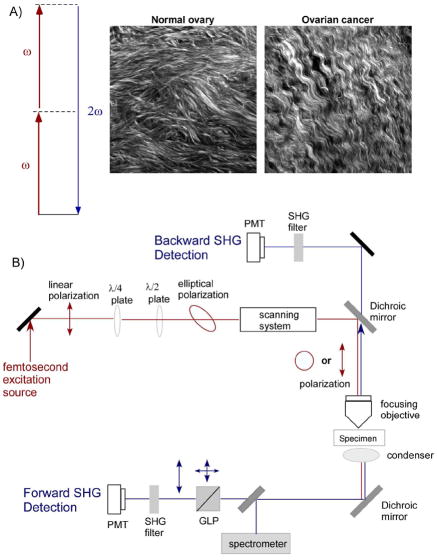
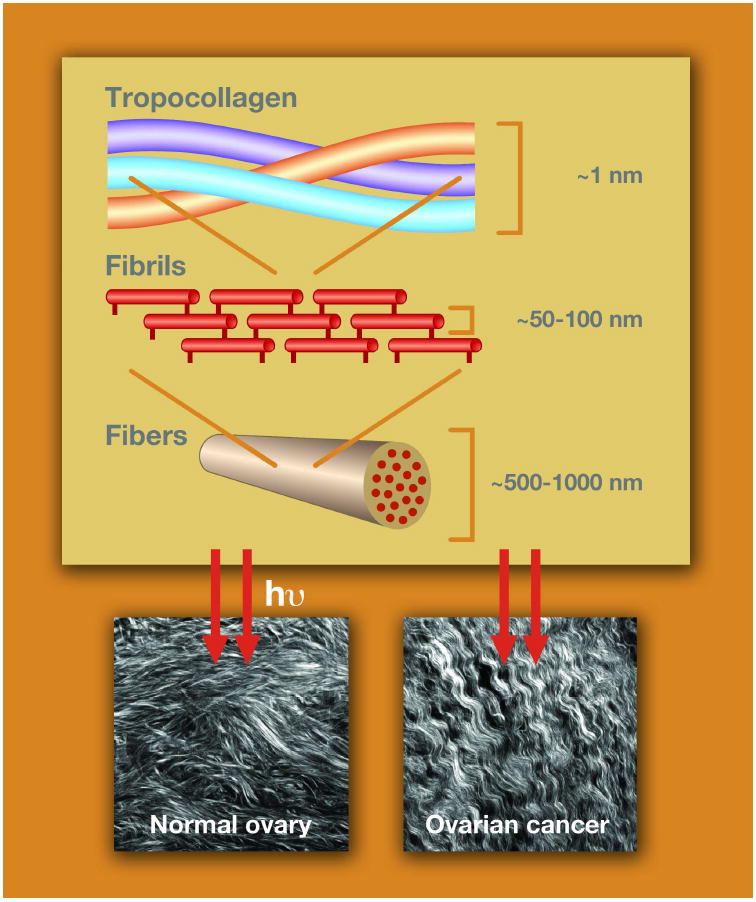
Overview of SHG photophysics, representative images, and instrumentation. A) The Jablonski diagram for non-resonant SHG. Typical laser and SHG wavelengths are 900 and 450 nm, respectively. The images are representative single optical sections (field size = 170 μm) of the collagen fibers in normal human ovary (left) and malignant ovary (right), in which striking differences in collagen morphology are revealed by SHG. B) Schematic of a typical SHG microscope optimized for forward and backward detection. Polarization optics in the excitation and signal paths (omitted from the backward path for figure clarity) allow detailed structural analysis of collagen organization. The forward and backward detectors are identical, and the paths are calibrated for collection and detection efficiency. PMT=photomultiplier, GLP=Glan-Laser Polarizer, λ/2 and λ/4=half and quarter wave plates, respectively.
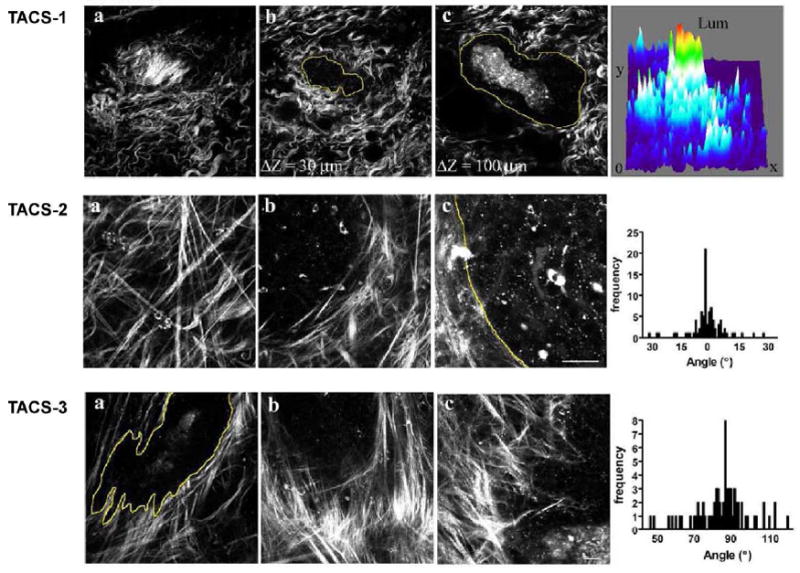
Representative methods of quantifying changes in protein fiber alignment in breast cancer by SHG microscopy. SHG probes changes in collagen in the stroma in breast cancer in a mouse model, in which disease progresses through three identifiable stages (TACS, see text) with different collagen organization. Adapted from ref. ; images courtesy of Patricia Keely.
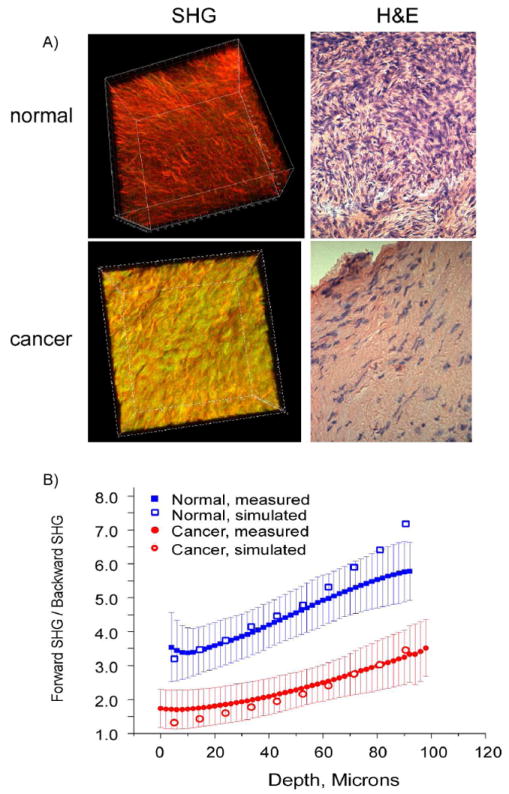
SHG imaging of human ovarian cancer. A) 3D SHG renderings (left panels) and H&E staining (right panels) of normal (top) and malignant (bottom) ovarian tissues. The field size for the 3D renderings was 170 μm and the histology cross sections were captured at 40x. Both the SHG and histological images reveal that the malignant tissues are characterized by a denser 3D collagen structure with lower cell density. B) Monte Carlo simulations of the measured F/B response for normal (blue) and malignant (red) ovarian tissues using measured bulk optical parameters. The best fit simulation to the data in each case is overlapped with the experimental data.
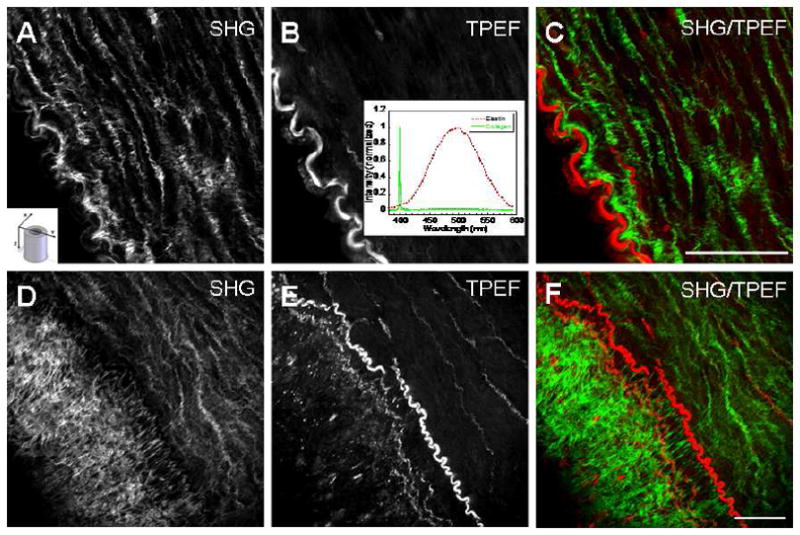
Combined SHG and two-photon excited fluorescence (TPEF, or MAF) of cardiovascular disease in a porcine model of obesity reported by Cheng and coworkers. The top panel shows data for the control animal around the vessel lumen: (A) is the collagen component and (B) is the autofluorescence from the elastin barrier and (C) is the two color overlap depicting the clear spatial separation of these proteins (green is collagen and red is elastin) present in normal anatomy. The insets depict (A) the imaging orientation relative to the vessel and (B) the SHG and fluorescence spectra. Panels D–F show the analogous images in the disease model, revealing dense collagen on the distal side of elastin, where this is the beginning of an arterial plaque. The figure is reproduced from ref. with permission from SPIE Publications.
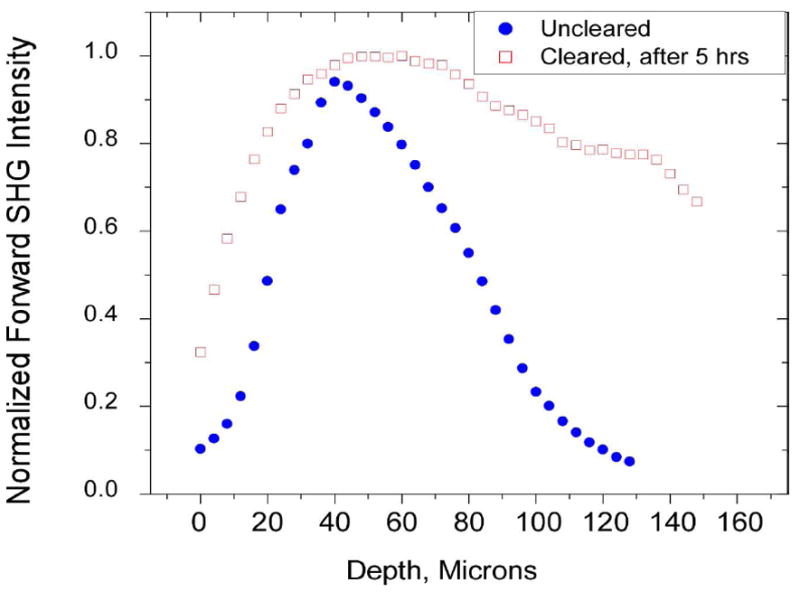
SHG imaging of optical clearing in tendon. Forward SHG attenuation data for the uncleared and cleared tendon (5 h treatment with 50% glycerol). Clearing results in increased swelling and a decrease in the rate of the axial attenuation. Integration under the curves reflects the entire SHG intensity before and after clearing, in which the SHG enhancement factor was ~2×. Reproduced from ref. with permission from SPIE Publications.
References
Publication types
MeSH terms
Grants and funding
LinkOut - more resources
Full Text Sources
Other Literature Sources
Medical
