. 2011 Aug;35(8):1550-6.
doi: 10.1111/j.1530-0277.2011.01492.x. Epub 2011 Mar 29.

Effects of alcohol on histone deacetylase 2 (HDAC2) and the neuroprotective role of trichostatin A (TSA)

Affiliations

Effects of alcohol on histone deacetylase 2 (HDAC2) and the neuroprotective role of trichostatin A (TSA)

Marisela Agudelo et al. Alcohol Clin Exp Res. 2011 Aug.

Abstract

Background: Previous studies have implicated histone deacetylases (HDACs) and HDAC inhibitors (HDIs) such as trichostatin A (TSA) in the regulation of gene expression during drug addiction. Furthermore, an increase in HDAC activity has been linked to neurodegeneration. Alcohol has also been shown to promote abundant generation of reactive oxygen species (ROS) resulting in oxidative stress. TSA inhibits HDACs and has been shown to be neuroprotective in other neurodegenerative disease models. Although HDACs and HDIs have been associated with drug addiction, there is no evidence of the neurodegenerative role of HDAC2 and neuroprotective role of TSA in alcohol addiction. Therefore, we hypothesize that alcohol modulates HDAC2 through mechanisms involving oxidative stress.

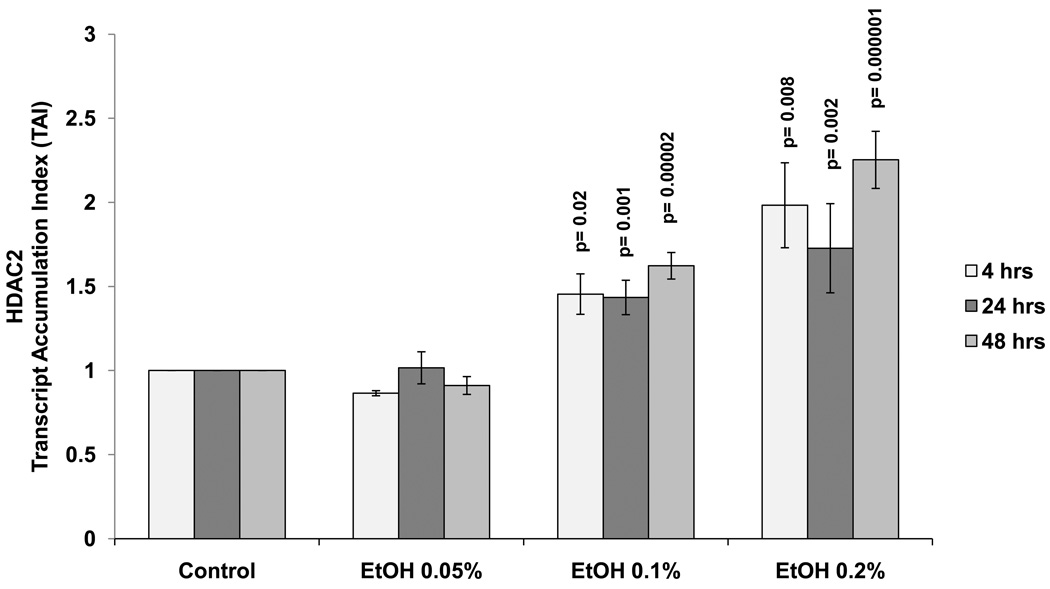
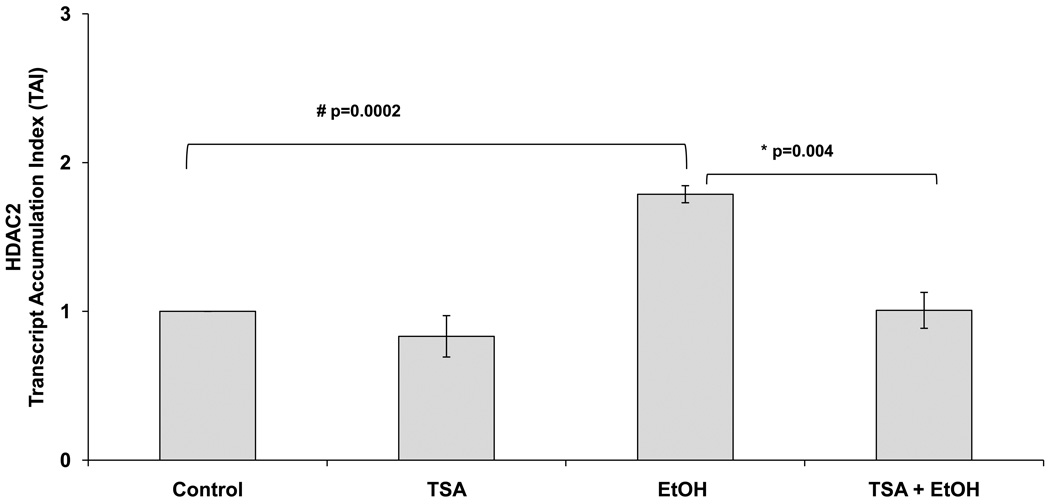
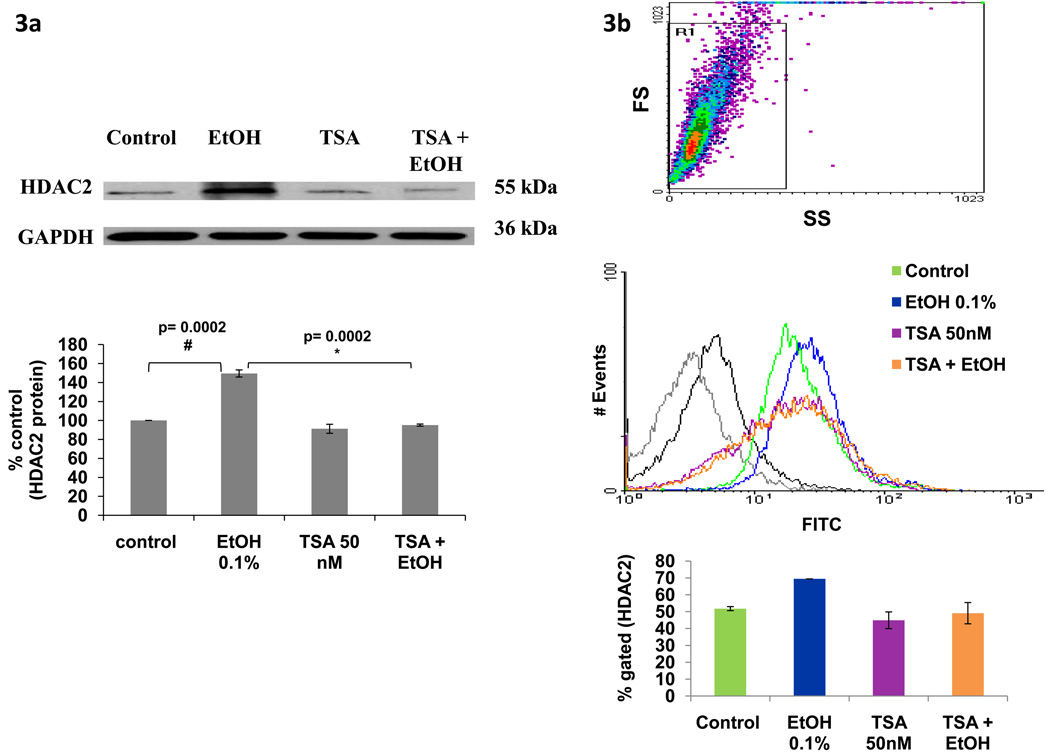
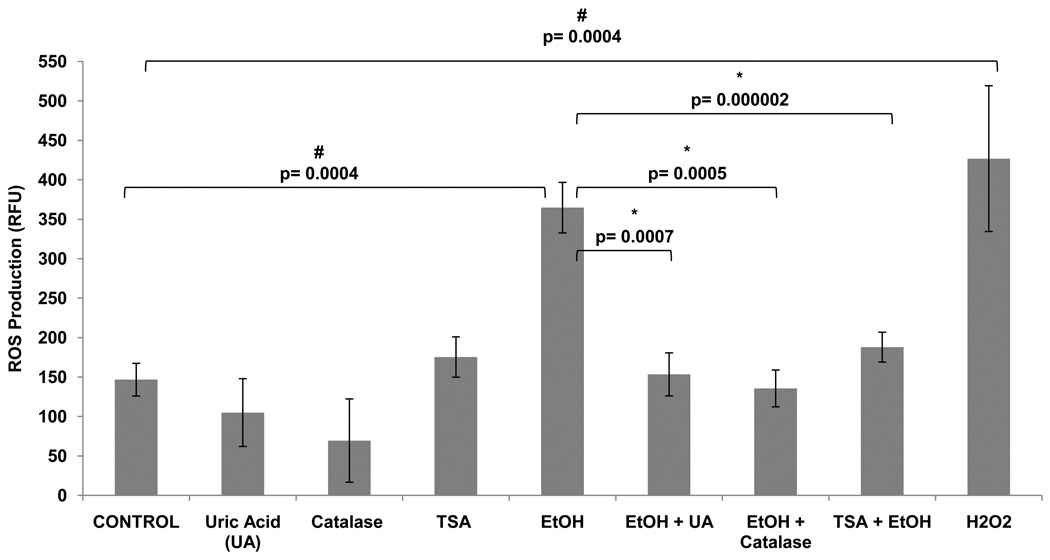
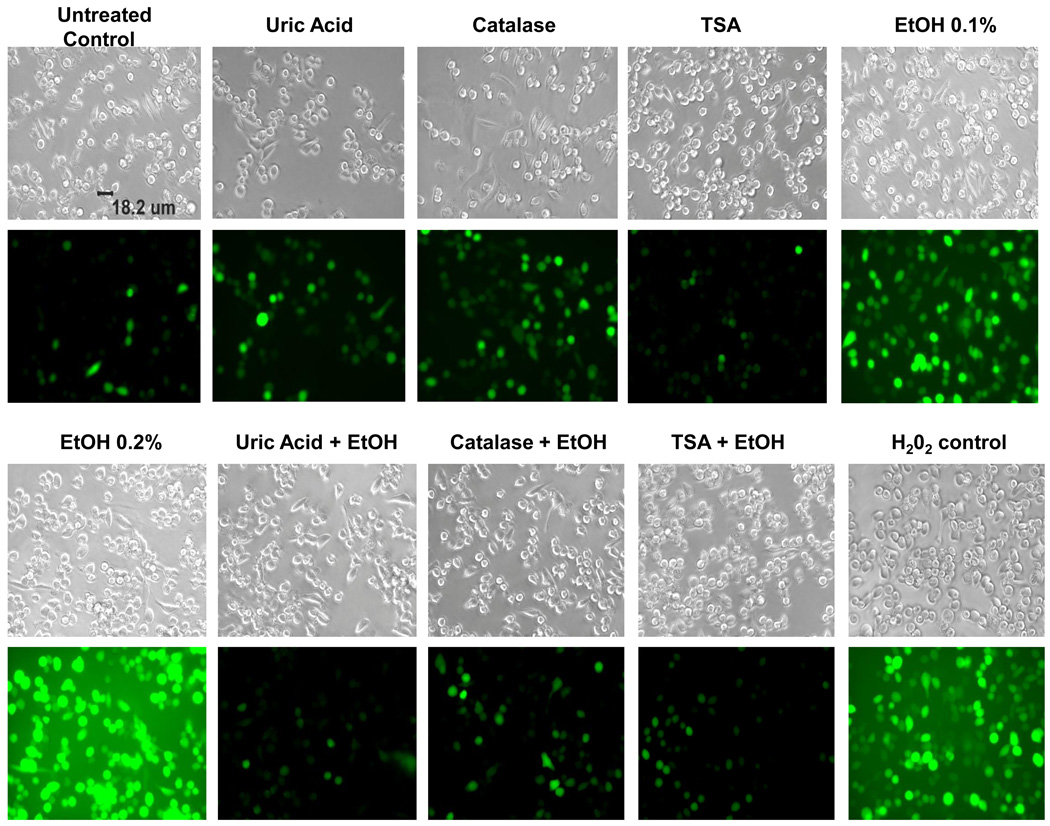
Methods: To test our hypothesis, the human neuronal cell line, SK-N-MC, was treated with different concentrations of ethanol (EtOH); HDAC2 gene and protein expression were assessed at different time points. Pharmacological inhibition of HDAC2 with TSA was evaluated at the gene level using qRT-PCR and at the protein level using Western blot and flow cytometry. ROS production was measured with a fluorescence microplate reader and fluorescence microscopy.

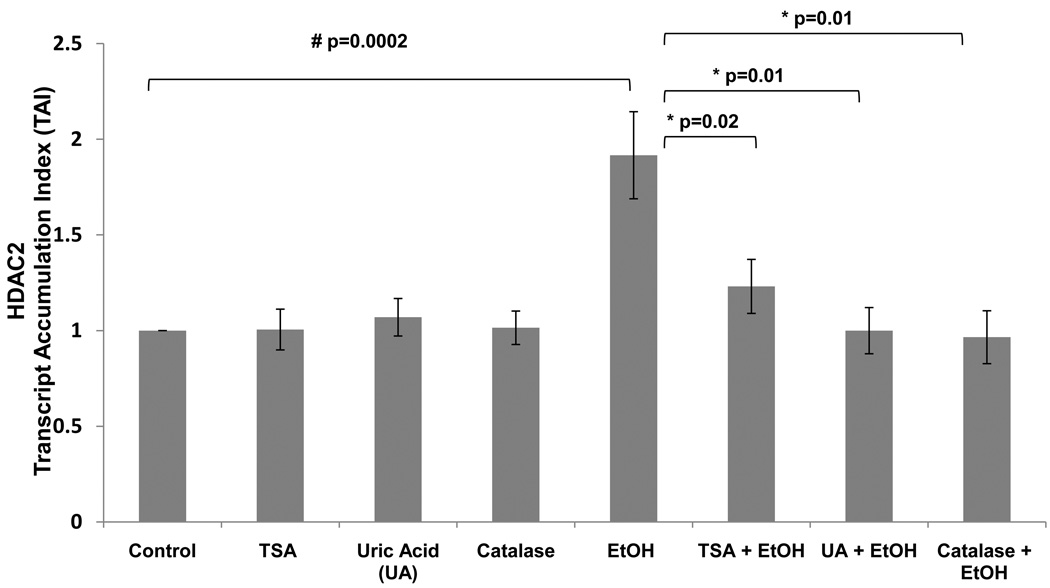
Results: Our results showed a dose-dependent increase in HDAC2 expression with EtOH treatment. Additionally, alcohol significantly induced ROS, and pharmacological inhibition of HDAC2 with TSA was shown to be neuroprotective by significantly inhibiting HDAC2 and ROS.

Conclusions: These results suggest that EtOH can upregulate HDAC2 through mechanisms involving oxidative stress and HDACs may play an important role in alcohol use disorders (AUDs). Moreover, the use of HDIs may be of therapeutic significance for the treatment of neurodegenerative disorders including AUDs.


Figures

Figure 1
Figure 1. Alcohol Induces HDAC2 Gene Expression
SK-N-MC (5 × 10⁵ cells/ml) were incubated in 6-well plates overnight to allow attachment and 60% confluency. They were treated with EtOH (0.05%-0.2%) for 4–48 hours. After incubation, the cells were harvested, RNA was extracted and reverse transcribed followed by qRT- PCR for HDAC2 and endogenous GAPDH and 18S rRNA gene expression. Data are expressed as mean ± SEM of TAI values of three independent experiments. A value of p ≤ 0.05 was indicative of significance.
Figure 2
Figure 2. Alcohol Induces HDAC2 Gene and this Effect is Inhibited by TSA
After reaching confluency, SK-N-MC were pre-treated with TSA (50 nM) for 2 hours, then treated with EtOH (0.1%) for 24 hours. After incubation, cells were harvested, RNA was extracted and reverse transcribed followed by qRT- PCR for HDAC2 and housekeeping GAPDH and 18sRNA gene expression. EtOH significantly enhanced HDAC2, while TSA + EtOH treatment significantly inhibited HDAC2 gene. Data are expressed as mean ± SEM of TAI values of at least three independent experiments. # represents significance compared to control. * represents significance compared to EtOH treatment.
Figure 3
Figure 3. Alcohol Induces HDAC2 Protein and this Effect is Inhibited by TSA
After reaching confluency, SK-N-MC were pre-incubated with TSA for 2 hours, then treated with EtOH (0.1%) for 48 hours. In figure 3a, 10 µg of protein were analyzed using western blot with primary anti-HDAC2 and secondary anti-IgG-HRP antibodies. GAPDH was used as a loading control. Data presented show a representative blot indicating modulation of HDAC2 protein expression and a bar graph representing the mean ± SE of % densitometry values of HDAC2 protein levels (% control) of three independent experiments. # represents significance compared to control. * represents significance compared to EtOH treatment. For the flow cytometry experiments, 1 × 10⁶ cells were fixed and permeabilized prior to intracellular staining with primary anti-HDAC2 and secondary anti-IgG-FITC antibody. Data presented in figure 3b show a representative histogram overlay of the gated cells. The bar graph represents the mean ± SE of % of gated cells expressing HDAC2. 10000 events were analyzed per sample. The gray and black histograms represent the unlabeled and secondary antibody controls respectively; the green histogram is the untreated control (~52%), blue represents EtOH (~69 %), purple represents TSA (~45%), and orange represents TSA + EtOH (~49%) treated cells. Data are representative of three independent experiments.
Figure 4
Figure 4. Alcohol Induces ROS Production and this Effect is Inhibited by Antioxidants and TSA
SK-N-MC (1 × 10⁵ cells) were incubated in 96-well plates overnight. Then, the cells were pre-incubated with TSA or antioxidants: uric acid (50 µM) or catalase (0.001 mg) for 2 hours, DCF-DA (100 µM) for 1 hour, then treated with EtOH or H2O2 (50 µM). Levels of ROS were measured with the Biotek Synergy HT plate reader. The fluorescence was detected at 485 excitation and at 528 emission spectra. Data are expressed as mean ± SE of RFU values of six independent experiments. A value of p ≤ 0.05 was indicative of significance. # represents significance compared to control. * represents significance compared to EtOH treatment.
Figure 5
Figure 5. Alcohol-induced ROS Production as Measured by Fluorescence Microscopy
SKN-MC (1 × 10⁵ cells) were incubated in 96-well plates overnight. Then, the cells were pre-incubated with TSA or antioxidants: uric acid (50 µM) or catalase (0.001 mg) for 2 hours, DCF-DA (100 µM) for 1 hr., then treated with EtOH (0.1–0.2 %) H2O2 (50 µM) was used as a positive control. Reactive oxygen species were observed using fluorescence microcopy. Fluorescence images were captured with an Olympus IX51 microscope. Images are representative of three independent experiments.
Figure 6
Figure 6. Alcohol Induces HDAC2 Gene Expression and this Effect is Inhibited by Antioxidants
After reaching confluency, SK-N-MC were pre-treated with TSA (50 nM) for 2 hrs, then treated with EtOH (0.1%) for 24 hrs. After incubation, cells were harvested, RNA was extracted and reverse transcribed followed by qRT- PCR for HDAC2 and endogenous GAPDH and 18S rRNA, gene expression. Data are expressed as mean ± SEM of TAI values of three independent experiments. # represents significance compared to control. * represents significance compared to EtOH treatment.

References

    1. Alan PK, Yihua C, Tapadar S, Nancy EL, Peter MB, Zhenyu Z, Melissa ADA, Weng-Long W, Yong S, Brett L. Searching for Disease Modifiers - PKC Activation and HDAC Inhibition - A Dual Drug Approach to Alzheimer's Disease that Decreases Abeta Production while Blocking Oxidative Stress. ChemMedChem. 2009;4:1095–1105. - PMC - PubMed
    1. Bai S, Ghoshal K, Datta J, Majumder S, Yoon SO, Jacob ST. DNA Methyltransferase 3b Regulates Nerve Growth Factor-Induced Differentiation of PC12 Cells by Recruiting Histone Deacetylase 2. Mol. Cell. Biol. 2005;25:751–766. - PMC - PubMed
    1. Bannister A. Key epigenetic processes & links to cancer by Dr. Andy Bannister (Cambridge University) The role of epigenetics in cancer. 2010 Abcam plc.
    1. D'Mello SR. Histone deacetylases as targets for the treatment of human neurodegenerative diseases. Drug news & perspectives. 2009;22:513–524. - PMC - PubMed
    1. Gandhi N, Saiyed ZM, Napuri J, Samikkannu T, Reddy PVB, Agudelo M, Khatavkar P, Saxena SK, Nair MPN. Interactive role of human immunodeficiency virus type 1 (HIV-1) clade-specific Tat protein and cocaine in blood-brain barrier dysfunction: Implications for HIV-1 associated neurocognitive disorder. Journal of Neurovirology. 2010;16:294–305. - PubMed

Publication types

MeSH terms