. 2011 May;14(5):484-92.
doi: 10.1111/j.1461-0248.2011.01610.x. Epub 2011 Mar 30.

Climate change threatens European conservation areas

Affiliations
Free PMC article

Climate change threatens European conservation areas

Miguel B Araújo et al. Ecol Lett. 2011 May.
Free PMC article

Abstract

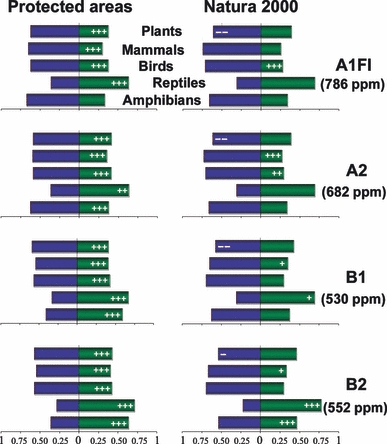
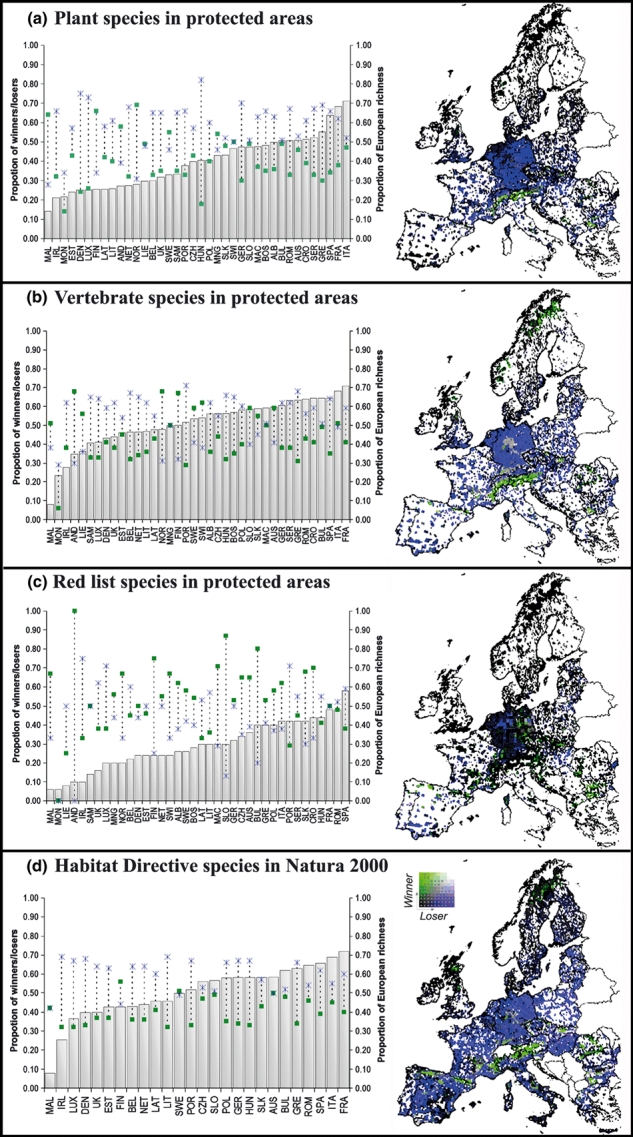
Europe has the world's most extensive network of conservation areas. Conservation areas are selected without taking into account the effects of climate change. How effectively would such areas conserve biodiversity under climate change? We assess the effectiveness of protected areas and the Natura 2000 network in conserving a large proportion of European plant and terrestrial vertebrate species under climate change. We found that by 2080, 58 ± 2.6% of the species would lose suitable climate in protected areas, whereas losses affected 63 ± 2.1% of the species of European concern occurring in Natura 2000 areas. Protected areas are expected to retain climatic suitability for species better than unprotected areas (P < 0.001), but Natura 2000 areas retain climate suitability for species no better and sometimes less effectively than unprotected areas. The risk is high that ongoing efforts to conserve Europe's biodiversity are jeopardized by climate change. New policies are required to avert this risk.


Figures

Figure 1
Figure 1
Proportion of species projected to gain (winners; green) or lose (losers; blue) climatic suitability in European conservation areas under four emission scenarios by 2080 (ppm are ‘part per million’ concentrations of CO2eq). Projections are provided for all modelled species in protected areas and for EU Bird & Habitat Directive species occurring in the Natura 2000. Conservation areas retaining more climatic suitability for species than expected in randomly selected unprotected areas are marked with +++ (P<0.001), ++ (P < 0.01), + (P < 0.05), whereas conservation areas retaining less climatic suitability for species than expected in randomly selected unprotected areas are marked with −− (P < 0.01) and − (0.05).
Figure 2
Figure 2
Geographical distribution of winners and losers. Left – The proportion of European species that occur in each individual country (bars, left axis) against the proportion of projected loser (blue asterisks, right axis) and winner species (green squares, right axis) as projected for 2080 with the A1FI scenario: (a) plant species occurring in protected areas; (b) vertebrate species occurring in protected areas; (c) IUCN Red data vertebrate and plant species occurring in protected areas (n=52); (d) Bird & Habitat directive vertebrate and plant species occurring in Natura 2000 sites (n=317). Notice that countries on the x-axis are ordered by the proportion of European species that occur in them. Right – Overlay between richness of species losing and winning suitable climate in conservation areas. Scores are divided into 10 equal-interval colour classes, where increasing intensities of blue represent increasing numbers of species losing suitable climate in conservation areas and increasing intensities of green represent increasing numbers of species winning suitable climate; shades of grey represent linearly covarying scores between winners and losers. All 10′ latitude and longitude cells with > 0% coverage with conservation areas are coloured. Regions with several small-sized conservation areas appear to have greater degree of protection but for the analyses, the percentage of grid-cell coverage by conservation areas was computed (Figure S1) and combined with modelled climatic suitabilities for each species. Country abbreviations are as follows: ALB – Albania; AND – Andorra; AUS – Austria, BEL – Belgium; BOS – Bosnia & Herzegovina; BUL – Bulgaria; CRO – Croatia; CZH – Czech Republic; DEN – Denmark; EST – Estonia; FIN – Finland; FRA – France; GER – Germany; GRE – Greece; HUN – Hungary; IRL – Ireland; ITA – Italy; LAT – Latvia; LIE – Liechtenstein; LIT – Lithuania; LUX – Luxembourg; MAC – Macedonia; MAL – Malta; MNG – Montenegro; MON – Monaco; NET – Netherlands; NOR – Norway; POL – Poland; POR – Portugal; ROM – Romania; SAM – San Marino; SER – Serbia; SLK – Slovakia; SLO – Slovenia; SPA – Spain; SWE – Sweden; SWI – Switzerland; UK – United Kingdom.
Figure 3
Figure 3
Vulnerability of cold-adapted vs. warm-adapted Bird & Habitat Directive species occurring in Natura 2000 areas: (a) overlay between richness of cold-adapted loser and winner species; (b) overlay between richness of warm-adapted loser and winner species. Scores on the maps are divided into 10 equal-interval colour classes, where increasing intensities of blue represent increasing numbers of loser species and increasing intensities of green represent increasing number of winner species; shades of grey represent linearly covarying scores between winners and losers; (c) Frequency distribution of the range sizes (number of grid cells occupied) of cold-adapted (empty bars) and warm-adapted loser species (dark bars) (W = 1530, P < 0.001); (d) Frequency distribution of range sizes of cold-adapted (empty bars) and warm-adapted winner species (dark bars) (W = 3, P = 0.100).
Figure 4
Figure 4
Distribution of non-analogue climates in 2080 under the A1FI emission scenario. For each variable (mean temperature of the coldest month, mean annual summed precipitation, mean annual growing degree days, and the ratio of mean annual actual evapotranspiration over mean annual potential evapotranspiration), non-analogue climates are defined as those exceeding the highest and lowest values recorded for the baseline. Colours indicate ‘richness’ of non-analogue climates, i.e. the summed occurrence of non-analogue climates for each variable, where increasing gradients of red indicate increased richness of non-analogue climates and white cells indicate absence of non-analogue climates.

References

    1. Alagador D, Martins MJ, Cerdeira JO, Cabeza M, Araújo MB. A probabilistic-based approach to match species with reserves when data are at different resolutions. Biol. Conserv. 2011;144:811–820.
    1. Anderson BJ, Akçakaya HR, Araújo MB, Fordham DA, Martinez-Meyer E, Thuiller W, et al. Dynamics of range margins for metapopulations under climate change. Proc. R. Soc. Lond. B. 2009;276:1415–1420. - PMC - PubMed
    1. Araújo MB. Matching species with reserves - uncertainties from using data at different resolutions. Biol. Conserv. 2004;118:533–538.
    1. Araújo MB, Guisan A. Five (or so) challenges for species distribution modelling. J. Biogeogr. 2006;33:1677–1688.
    1. Araújo MB, New M. Ensemble forecasting of species distributions. Trends Ecol. Evol. 2007;22:42–47. - PubMed