

Monitoring the reversible B to A-like transition of DNA in eukaryotic cells using Fourier transform infrared spectroscopy
- PMID: 21447564
- PMCID: PMC3141270
- DOI: 10.1093/nar/gkr175
Monitoring the reversible B to A-like transition of DNA in eukaryotic cells using Fourier transform infrared spectroscopy
Abstract
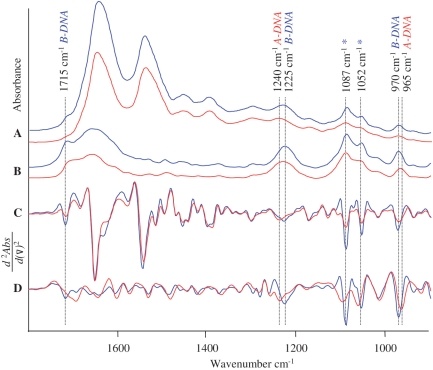
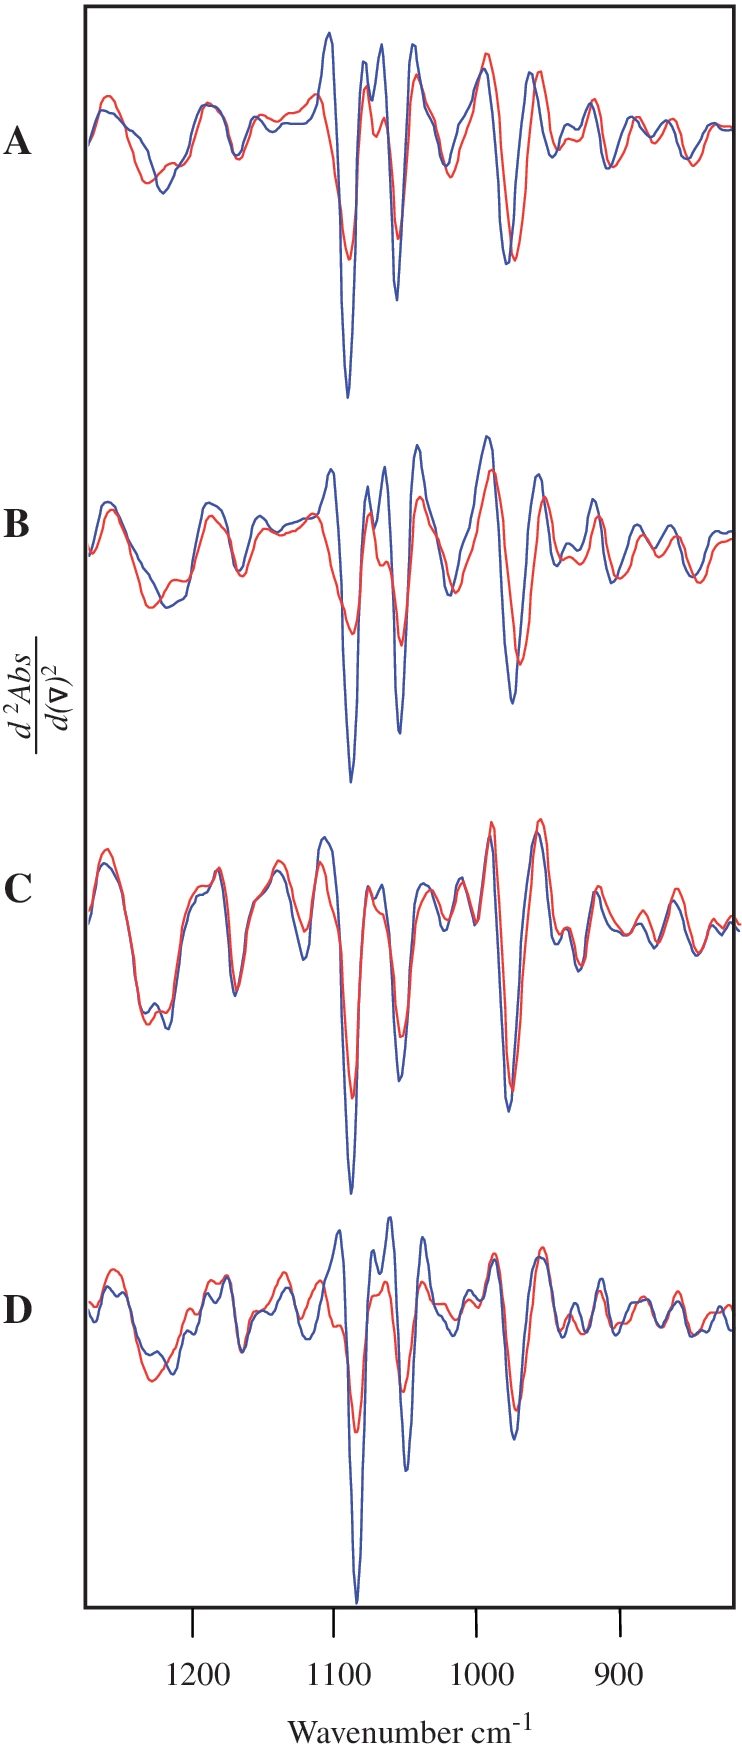
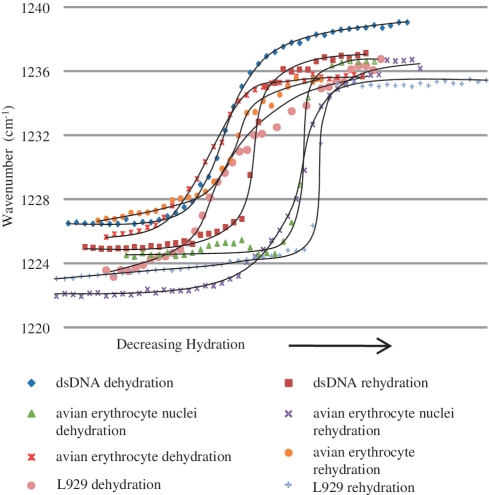
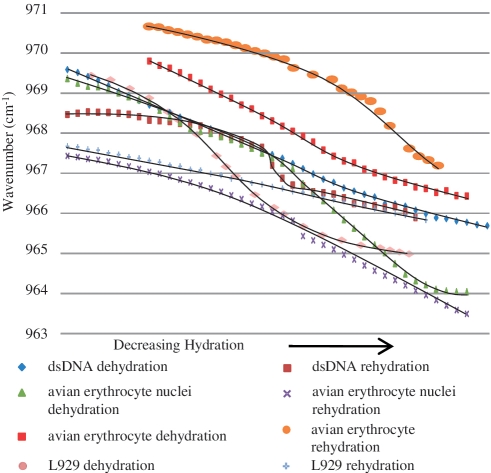
The ability to detect DNA conformation in eukaryotic cells is of paramount importance in understanding how some cells retain functionality in response to environmental stress. It is anticipated that the B to A transition might play a role in resistance to DNA damage such as heat, desiccation and toxic damage. To this end, conformational detail about the molecular structure of DNA has been derived primarily from in vitro experiments on extracted or synthetic DNA. Here, we report that a B- to A-like DNA conformational change can occur in the nuclei of intact cells in response to dehydration. This transition is reversible upon rehydration in air-dried cells. By systematically monitoring the dehydration and rehydration of single and double-stranded DNA, RNA, extracted nuclei and three types of eukaryotic cells including chicken erythrocytes, mammalian lymphocytes and cancerous rodent fibroblasts using Fourier transform infrared (FTIR) spectroscopy, we unequivocally assign the important DNA conformation marker bands within these cells. We also demonstrate that by applying FTIR spectroscopy to hydrated samples, the DNA bands become sharper and more intense. This is anticipated to provide a methodology enabling differentiation of cancerous from non-cancerous cells based on the increased DNA content inherent to dysplastic and neoplastic tissue.
Figures
References
-
- Lever E, Sheer D. The role of nuclear organization in cancer. J. Pathol. 2010;220:114–125. - PubMed
-
- Dickerson RE. Definitions and nomenclature of nucleic acid structure parameters. J. Biomol. Struct. Dynam. 1989;6:627–634. - PubMed
-
- Hunter CA. Sequence-dependent DNA-structure – the role of base stacking interactions. J. Mol. Biol. 1993;230:1025–1054. - PubMed
-
- Florentiev VL, Ivanov VI. RNA polymerase - 2-step mechanism with overlapping steps. Nature. 1970;228:519–526. - PubMed
-
- Eom SH, Wang JM, Steitz TA. Structure of Taq polymerase with DNA at the polymerase active site. Nature. 1996;382:278–281. - PubMed
Publication types
MeSH terms
Substances
LinkOut - more resources
Full Text Sources
Other Literature Sources
Molecular Biology Databases
