. 2011 Aug;90(2):221-33.
doi: 10.1189/jlb.0111006. Epub 2011 Mar 29.

Nuclear phospholipid scramblase 1 prolongs the mitotic expansion of granulocyte precursors during G-CSF-induced granulopoiesis

Affiliations

Nuclear phospholipid scramblase 1 prolongs the mitotic expansion of granulocyte precursors during G-CSF-induced granulopoiesis

Chun-Wei Chen et al. J Leukoc Biol. 2011 Aug.

Abstract

PLSCR1-/- mice exhibit normal, steady-state hematologic parameters but impaired emergency granulopoiesis upon in vivo administration of G-CSF. The mechanism by which PLSCR1 contributes to G-CSF-induced neutrophil production is largely unknown. We now report that the expansion of bone marrow myelocytes upon in vivo G-CSF treatment is reduced in PLSCR1-/- mice relative to WT. Using SCF-ER-Hoxb8-immortalized myeloid progenitors to examine the progression of G-CSF-driven granulocytic differentiation in vitro, we found that PLSCR1 prolongs the period of mitotic expansion of proliferative granulocyte precursors, thereby giving rise to increased neutrophil production from their progenitors. This effect of PLSCR1 is blocked by a ΔNLS-PLSCR1, which prevents its nuclear import. By contrast, mutation that prevents the membrane association of PLSCR1 has minimal impact on the role of PLSCR1 in G-CSF-induced granulopoiesis. These data imply that the capacity of PLSCR1 to augment G-CSF-dependent production of mature neutrophils from myeloid progenitors is unrelated to its reported activities at the endofacial surface of the plasma membrane but does require entry of the protein into the nucleus, suggesting that this response is mediated through the observed effects of PLSCR1 on gene transcription.


Figures
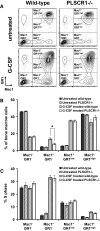
Figure 1.
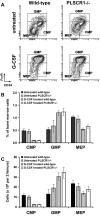
Figure 1.. Cell cycle analysis of mouse bone marrow cells in response to in vivo G-CSF treatment.
Administration of G-CSF and BrdU to mice was detailed in Materials and Methods. Bone marrow cells collected 1 h after BrdU injection were stained with anti-Mac1, anti-GR1, and anti-BrdU antibodies. (A) Representative Mac1/GR1 flow cytometric profiles of bone marrow cells from untreated and G-CSF-treated WT and PLSCR1−/− mice. (B) Percentage of Mac1/GR1, Mac1+/GR1, Mac1+/GR1low, and Mac1+/GR1high cells in total bone marrow cells. (C) Analysis of percentage cells in S-phase assessed by BrdU incorporation. Data represent mean ± sem of untreated WT (black bars; n=4), untreated PLSCR1−/− (hatched bars; n=4), G-CSF-treated WT (gray bars; n=5), and G-CSF-treated PLSCR1−/− (white bars; n=5) mice. *P < 0.05 by Student's t test.
Figure 2.
Figure 2.. Flow cytometric analysis of bone marrow myeloid progenitor populations in response to in vivo G-CSF treatment.
Administration of G-CSF to mice and staining of bone marrow samples were detailed in Materials and Methods. Lin/Sca-1/c-kit+ cells were pre-gated from total bone marrow cells and further divided into CD34+/FcγRlow (CMP), CD34+/low/ FcγR+ (GMP), and CD34low/–/FcγRlow/– (MEP). (A) Representative CD34/FcγR flow cytometric profiles of the bone marrow samples from untreated and G-CSF-treated WT and PLSCR1−/− mice. (B) Percentage of CMP, GMP, and MEP derived from flow cytometric analysis, as depicted in A. (C) Absolute numbers of CMP, GMP, and MEP harvested from each mouse were calculated by multiplying the total number of nucleated cells obtained from each mouse (untreated WT, 2.26±0.55×10⁷; untreated PLSCR1−/−, 2.20±0.42×10⁷; G-CSF-treated WT, 2.54±0.56×10⁷; G-CSF-treated PLSCR1−/−, 2.74±0.65×10⁷) by the percentage of CMP, GMP, and MEP (from B). Data represent mean ± sem of untreated WT (black bars; n=4), untreated PLSCR1−/− (hatched bars; n=4), G-CSF-treated WT (gray bars; n=5), and G-CSF-treated PLSCR1−/− (white bars; n=5) mice.
Figure 3.
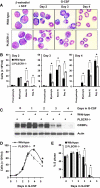
Figure 3.. G-CSF-induced granulopoiesis of SCF-ER-Hoxb8 myeloid progenitors.
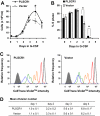
WT and PLSCR1−/− SCF-ER-Hoxb8 cells were cultured in the presence of G-CSF at a seeding concentration of 5 × 10⁴ cells/ml. (A) WT (upper panel) and PLSCR1−/− (lower panel) SCF-ER-Hoxb8 cells cultured in progenitor outgrowth medium (β-estradiol+SCF) and in basic medium supplemented with 2 ng/ml G-CSF (Days 2–4) were transferred to glass slides by cytospin and stained with Wright-Giemsa solution. Slides were examined at ×400 original magnification. (B) At the indicated times, the number of promyelocytes, myelocytes, Band N., and Seg. N. in WT (black bars) and PLSCR1−/− (white bars) cultures was determined by differential cell counts, as detailed in Materials and Methods. (C) Cell lysates of WT and PLSCR1−/− SCF-ER-Hoxb8 cells cultured in G-CSF were analyzed by Western blotting for C/EBPα (42 kDa) and actin. (D) Total live cell counts of WT (solid line) and PLSCR1−/− (dashed line) SCF-ER-Hoxb8 cells cultured in G-CSF for up to 5 days. (E) At the indicated times, cells were incubated with 10 μM BrdU at 37°C for 40 min, and the incorporated BrdU was detected by anti-BrdU antibody. The percentage of cells in S-phase of the cell cycle (BrdU+ cells) in WT (black bars) and PLSCR1−/− (white bars) cultures was determined by flow cytometry. Data represent mean ± sem of five independently immortalized SCF-ER-Hoxb8 cell lines, each from WT and PLSCR1−/− mouse bone marrow. *P < 0.05 by Student's t test.
Figure 4.
Figure 4.. Ectopic expression of PLSCR1 in PLSCR1−/− SCF-ER-Hoxb8 myeloid progenitors by retroviral transduction.
Clonal PLSCR1−/− SCF-ER-Hoxb8 cells were transduced with PLSCR1-expressing and vector pMIG retrovirus, and cells expressing comparable amounts of GFP were isolated by FACS, as detailed in Materials and Methods. Cell lysates of WT, PLSCR1−/−, and virally transduced PLSCR1−/− SCF-ER-Hoxb8 cells were analyzed by Western blotting for PLSCR1, GFP, and actin.
Figure 5.
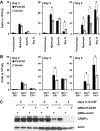
Figure 5.. Effect of ectopically expressed PLSCR1 on neutrophil production from SCF-ER-Hoxb8 myeloid progenitors.
PLSCR1-expressing and vector-infected PLSCR1−/− SCF-ER-Hoxb8 cells (see Fig. 4) were cultured in the presence of G-CSF at a seeding concentration of 5 × 10⁴ cells/ml. (A) Cells were transferred to glass slides by cytospin and stained with Wright-Giemsa solution at the indicated times. The number of promyelocytes, myelocytes, Band N., and Seg. N. in the cultures of PLSCR1-expressing (black bars) and vector-infected (white bars) cells was determined by differential cell counts, as detailed in Materials and Methods. (B) Cells were harvested at the indicated times, stained with anti-Mac1 (PE) and anti-GR1 antibodies, and analyzed by flow cytometry. The total live cell count was obtained for each sample, and the absolute number of Mac1/GR1, Mac1+/GR1, and Mac1+/GR1+ cells in the cultures of PLSCR1-expressing (black bars) and vector-infected (white bars) cells was calculated from their percentage of the total cell population derived by flow cytometry. (C) Cell lysates of PLSCR1-expressing and vector-infected cells cultured in G-CSF were analyzed by Western blotting for C/EBPα (42 kDa) and actin. Data represent mean ± sem of three each independently infected PLSCR1-expressing and vector-infected PLSCR1−/− cell lines. *P < 0.05 by Student's t test.
Figure 6.
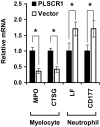
Figure 6.. Analysis of the expression level of stage-specific myeloid genes.
PLSCR1-expressing (black bars) and vector-infected (white bars) PLSCR1−/− SCF-ER-Hoxb8 cells were cultured in the presence of G-CSF for 3 days. The levels of MPO, CTSG, LF, and CD177 gene transcripts were determined by qPCR, as detailed in Materials and Methods. Data represent mean ± sem of three each independently infected PLSCR1-expressing and vector-infected PLSCR1−/− cell lines. *P < 0.05 by Student's t test.
Figure 7.
Figure 7.. Effect of PLSCR1 on the mitotic expansion of granulocyte precursors cultured in G-CSF.
PLSCR1-expressing and vector-infected PLSCR1−/− SCF-ER-Hoxb8 cells were cultured in the presence of G-CSF at a seeding concentration of 5 × 10⁴ cells/ml. (A) Total live cell counts of PLSCR1-expressing (solid line) and vector-infected (dashed line) cells cultured in G-CSF for up to 5 days. (B) At the indicated times, cells were incubated with 10 μM BrdU at 37°C for 40 min, and the incorporated BrdU was detected by anti-BrdU antibody. The percentage of cells in S-phase of the cell cycle (BrdU+ cells) in the cultures of PLSCR1-expressing (black bars) and vector-infected (white bars) cells was determined by flow cytometry. Data represent mean ± sem of three each independently infected PLSCR1-expressing and vector-infected PLSCR1−/− cell lines. *P < 0.05 by Student's t test. (C) Representative flow cytometric histogram plots of CellTrace Violet dye-labeled PLSCR1-expressing (left) and vector-infected (right) PLSCR1−/− SCF-ER-Hoxb8 cells cultured in G-CSF. The cells labeled with equivalent amounts of CellTrace Violet dye were isolated by FACS, and the fluorescence intensity of the cells before differentiation (black) and after culture in G-CSF for 1 day (red), 2 days (orange), 3 days (green), and 4 days (blue) is shown. The gray-filled histograms indicate the autofluorescence of SCF-ER-Hoxb8 cells not labeled with CellTrace Violet dye. (D) Mean division number of CellTrace Violet dye-labeled PLSCR1-expressing and vector-infected SCF-ER-Hoxb8 cells cultured in G-CSF was calculated by FlowJo curve-fitting software. Data represent mean ± sem of a triplicate experiment. *P < 0.05 by Student's t test.
Figure 8.
Figure 8.. Effect of mutant PLSCR1 on neutrophil production from SCF-ER-Hoxb8 myeloid progenitors.
Clonal PLSCR1−/− SCF-ER-Hoxb8 cells were transduced with WT PLSCR1, ΔPal-PLSCR1, ΔNLS-PLSCR1, and vector pMIG retrovirus, respectively. Cells expressing comparable amounts of GFP were isolated by FACS, as detailed in Materials and Methods, and then cultured in the presence of G-CSF at a seeding concentration of 5 × 10⁴ cells/ml for 4 days. The number of promyelocytes, myelocytes, Band N., and Seg. N. in each culture was determined by differential cell counts, as detailed in Materials and Methods. Data represent mean ± sem of three experiments. *P < 0.05 by Student's t test.
Figure 9.
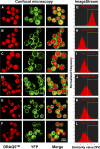
Figure 9.. Analysis of subcellular distribution of YFP-PLSCR1 in SCF-ER-Hoxb8 cells under G-CSF stimulation.
Clonal PLSCR1−/− SCF-ER-Hoxb8 cells expressing comparable amounts of YFP-ΔPal-PLSCR1 (A and G) or YFP-PLSCR1 (B and H) fusion proteins were isolated by FACS, as detailed in Materials and Methods. The YFP-PLSCR1-expressing cells were further cultured in the presence of G-CSF for 1 day (C and I), 2 days (D and J), 3 days (E and K), and 4 days (F and L), respectively. For confocal microscopy analysis (A–F), the cell nuclei were stained with DRAQ5 dye, and the samples were examined for DRAQ5 (red), YFP-PLSCR1 (green), and merge images at ×1000 original magnification with 0.5 μm scanning thickness using a Zeiss LSM 5 PASCAL laser-scanning microscope. For ImageStream multispectral image flow cytometry analysis (G–L), the cell nuclei were stained with DAPI. The SV between YFP-PLSCR1 and DAPI nuclear stain images of each single cell, as well as the mean SV of each sample, was analyzed using the similarity feature of IDEAS4.0 software.

Comment in

Similar articles

Cited by

References

    1. von Vietinghoff S., Ley K. (2008) Homeostatic regulation of blood neutrophil counts. J. Immunol. 181, 5183–5188 - PMC - PubMed
    1. Furze R. C., Rankin S. M. (2008) Neutrophil mobilization and clearance in the bone marrow. Immunology 125, 281–288 - PMC - PubMed
    1. Nicola N. A., Metcalf D., Matsumoto M., Johnson G. R. (1983) Purification of a factor inducing differentiation in murine myelomonocytic leukemia cells. Identification as granulocyte colony-stimulating factor. J. Biol. Chem. 258, 9017–9023 - PubMed
    1. Souza L. M., Boone T. C., Gabrilove J., Lai P. H., Zsebo K. M., Murdock D. C., Chazin V. R., Bruszewski J., Lu H., Chen K. K., et al. (1986) Recombinant human granulocyte colony-stimulating factor: effects on normal and leukemic myeloid cells. Science 232, 61–65 - PubMed
    1. Lieschke G. J., Grail D., Hodgson G., Metcalf D., Stanley E., Cheers C., Fowler K. J., Basu S., Zhan Y. F., Dunn A. R. (1994) Mice lacking granulocyte colony-stimulating factor have chronic neutropenia, granulocyte and macrophage progenitor cell deficiency, and impaired neutrophil mobilization. Blood 84, 1737–1746 - PubMed

Publication types

Substances