Gene expression signature-based prognostic risk score in gastric cancer
- PMID: 21447720
- PMCID: PMC3078023
- DOI: 10.1158/1078-0432.CCR-10-2180
Gene expression signature-based prognostic risk score in gastric cancer
Abstract
Purpose: Despite continual efforts to develop a prognostic model of gastric cancer by using clinical and pathologic parameters, a clinical test that can discriminate patients with good outcomes from those with poor outcomes after gastric cancer surgery has not been established. We aim to develop practical biomarker-based risk score that can predict relapse of gastric cancer after surgical treatment.
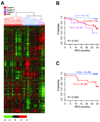
Experimental design: Microarray technologies were used to generate and analyze gene expression profiling data from 65 gastric cancer patients to identify biomarker genes associated with relapse. The association of expression patterns of identified genes with relapse and overall survival was validated in independent gastric cancer patients.
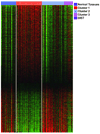
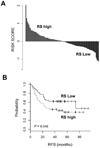
Results: We uncovered two subgroups of gastric cancer that were strongly associated with the prognosis. For the easy translation of our findings into practice, we developed a scoring system based on the expression of six genes that predicted the likelihood of relapse after curative resection. In multivariate analysis, the risk score was an independent predictor of relapse in a cohort of 96 patients. We were able to validate the robustness of the six-gene signature in an additional independent cohort.
Conclusions: The risk score derived from the six-gene set successfully prognosticated the relapse of gastric cancer patients after gastrectomy.
Conflict of interest statement
No potential conflicts of interest were disclosed
Figures


References
-
- Parkin DM, Bray F, Ferlay J, Pisani P. Global cancer statistics, 2002. CA Cancer J Clin. 2005;55:74–108. - PubMed
-
- Hundahl SA, Phillips JL, Menck HR. The National Cancer Data Base Report on poor survival of U.S. gastric carcinoma patients treated with gastrectomy: Fifth Edition American Joint Committee on Cancer staging, proximal disease, and the "different disease" hypothesis. Cancer. 2000. pp. 921–932. - PubMed
-
- Kovoor PA, Hwang J. Treatment of resectable gastric cancer: current standards of care. Expert Rev Anticancer Ther. 2009;9:135–142. - PubMed
-
- Moriguchi S, Maehara Y, Korenaga D, Sugimachi K, Nose Y. Risk factors which predict pattern of recurrence after curative surgery for patients with advanced gastric cancer. Surg Oncol. 1992;1(5):341–346. - PubMed
-
- Landry J, Tepper JE, Wood WC, Moulton EO, Koerner F, Sullinger J. Patterns of failure following curative resection of gastric carcinoma. Int J Radiat Oncol Biol Phys. 1990;19:1357–1362. - PubMed
Publication types
MeSH terms
Substances
Grants and funding
LinkOut - more resources
Full Text Sources
Other Literature Sources
Medical
Molecular Biology Databases

