

Probing dry-weight improves left ventricular mass index
- PMID: 21447945
- PMCID: PMC3078237
- DOI: 10.1159/000326235
Probing dry-weight improves left ventricular mass index
Abstract
Background: Although probing dry-weight improves blood pressure control, its effect on echocardiographic left ventricular mass index (LVMI) is unknown.
Methods: Shortly following dialysis, 292 echocardiograms in 150 patients participating in the DRIP trial were obtained at baseline and longitudinally every 4 weeks on 2 occasions.
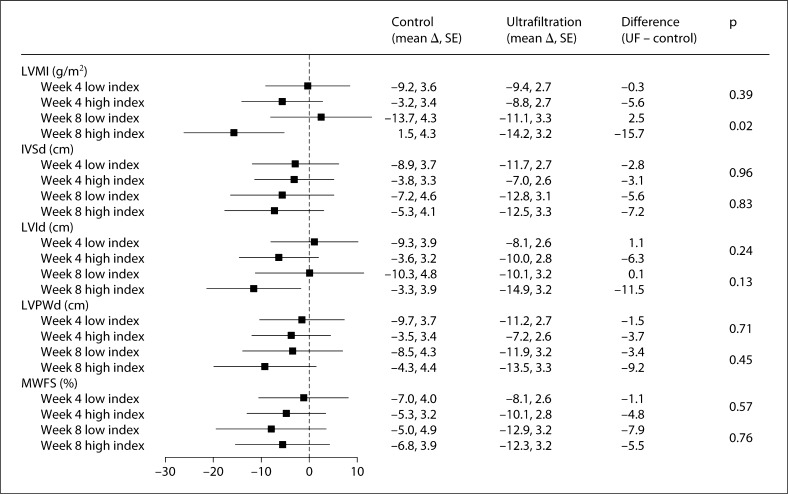
Results: At baseline, LVMI was 136.3 g/m(2) in the control group and 138.7 g/m(2) in the ultrafiltration group (p > 0.2 for difference). The change from baseline in LVMI in the control group was +3.5 g/m(2) at 4 weeks and +0.3 g/m(2) at 8 weeks (p > 0.2 for both changes). The change from baseline in LVMI in the ultrafiltration group was -7.4 g/m(2) at 4 weeks (p = 0.005) and -6.3 g/m(2) at 8 weeks (p = 0.045). With ultrafiltration, the change in LVMI diameter was -10.9 g/m(2) more compared to the control group at 4 weeks (p = 0.012) and -6.6 g/m(2) more compared to the control group at 8 weeks (p = 0.21). The reduction in interdialytic ambulatory blood pressure was also greater in response to probing dry-weight in those in the top half of LVMI at baseline (p = 0.02 for interaction effect at week 8).
Conclusion: LVMI, an important determinant of prognosis among long-term dialysis patients, is responsive to probing dry-weight.
Copyright © 2011 S. Karger AG, Basel.
Figures
Comment in
-
Left ventricular mass index as an outcome measure in clinical trials in dialysis patients: a word of caution.Am J Nephrol. 2011;33(4):370-2. doi: 10.1159/000326239. Epub 2011 Mar 30. Am J Nephrol. 2011. PMID: 21447944 No abstract available.
References
-
- Kannel WB. Left ventricular hypertrophy as a risk factor: the Framingham experience. J Hypertens Suppl. 1991;9:S3–S8. - PubMed
-
- Levy D, Garrison RJ, Savage DD, Kannel WB, Castelli WP. Prognostic implications of echocardiographically determined left ventricular mass in the Framingham Heart Study. N Engl J Med. 1990;322:1561–1566. - PubMed
-
- Devereux RB, Wachtell K, Gerdts E, Boman K, Nieminen MS, Papademetriou V, Rokkedal J, Harris K, Aurup P, Dahlof B. Prognostic significance of left ventricular mass change during treatment of hypertension. JAMA. 2004;292:2350–2356. - PubMed
-
- Levin A, Singer J, Thompson CR, Ross H, Lewis M. Prevalent left ventricular hypertrophy in the predialysis population: identifying opportunities for intervention. Am J Kidney Dis. 1996;27:347–354. - PubMed
-
- Levin A, Thompson CR, Ethier J, Carlisle EJ, Tobe S, Mendelssohn D, Burgess E, Jindal K, Barrett B, Singer J, Djurdjev O. Left ventricular mass index increase in early renal disease: impact of decline in hemoglobin. Am J Kidney Dis. 1999;34:125–134. - PubMed
Publication types
MeSH terms
Grants and funding
LinkOut - more resources
Full Text Sources
Medical
